


 |
| Gold V.1.3.1 signal Telegram Channel (English) |
EURUSD Technical Breakout: Steady Strength Above 1.1700 Sets Stage for Bullish Momentum, May 1, 2026
2026-05-01 @ 21:28
Over the past 24 to 48 hours, the EUR/USD pair steadily gained strength above the 1.1700 level, briefly touching around 1.1730 during the early Asian session. Yesterday’s closing price was 1.17276, reflecting the market reaction to the European Central Bank’s (ECB) decision to keep rates steady. The ECB’s hold on interest rates quelled short-term uncertainty over potential hikes, supporting the euro.
Meanwhile, rising tensions in Iran have driven safe-haven demand for the US dollar, keeping the DXY near 98 and causing short-term volatility in EUR/USD. Although the dollar has gained on geopolitical concerns, eurozone banks are facing tighter credit and stagflation risks, which pressure the euro. The market remains cautious, with investors awaiting the upcoming Federal Reserve announcement that is likely to add volatility.
For the average investor, the ECB’s steady rate decision temporarily eased fears of euro weakness, but geopolitical tensions have heightened uncertainty in FX markets. This means investors need to stay tuned closely to global political developments and central bank meetings, as these events can swiftly impact currency movements.
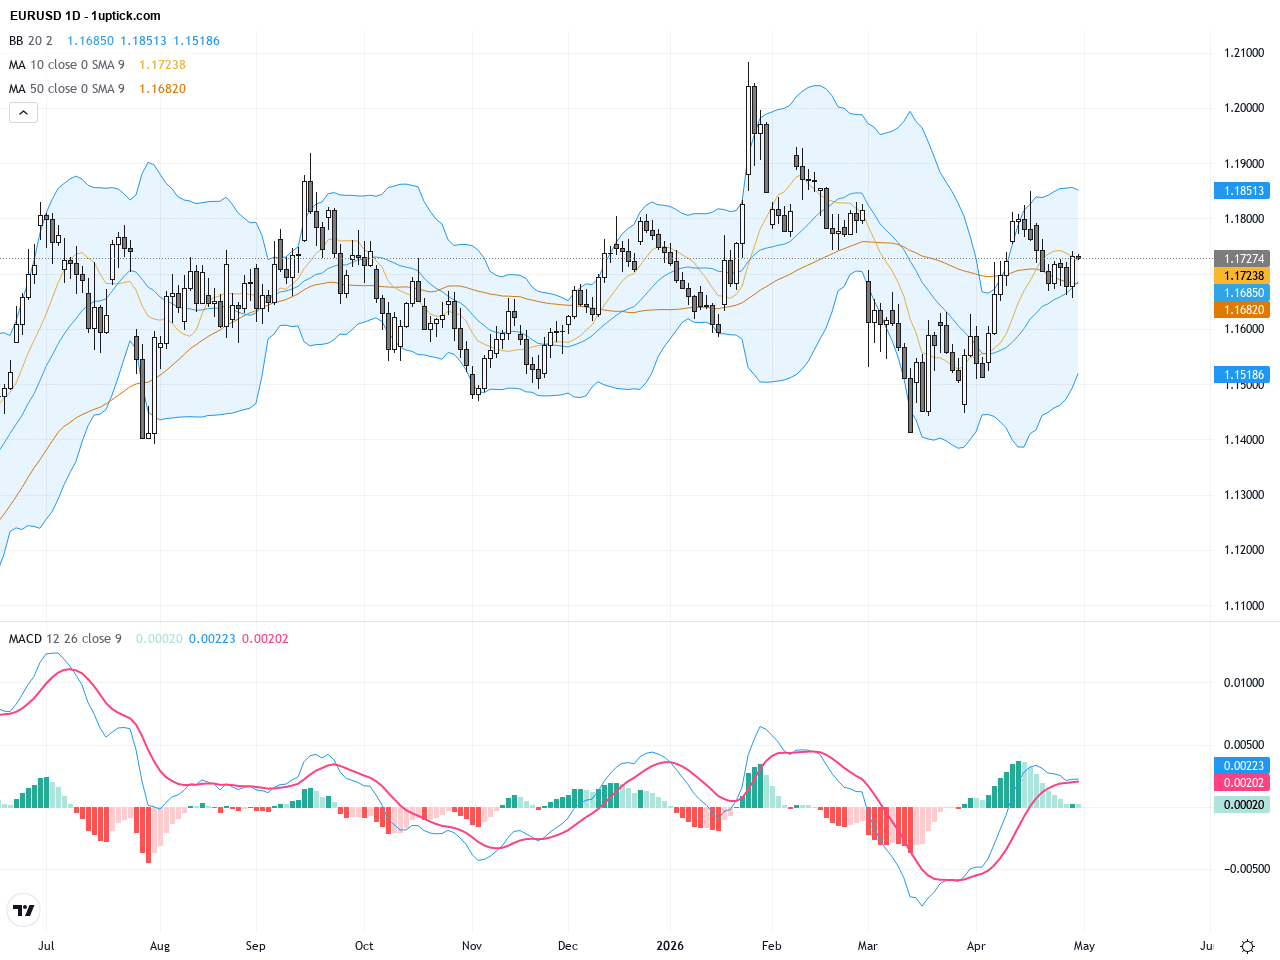
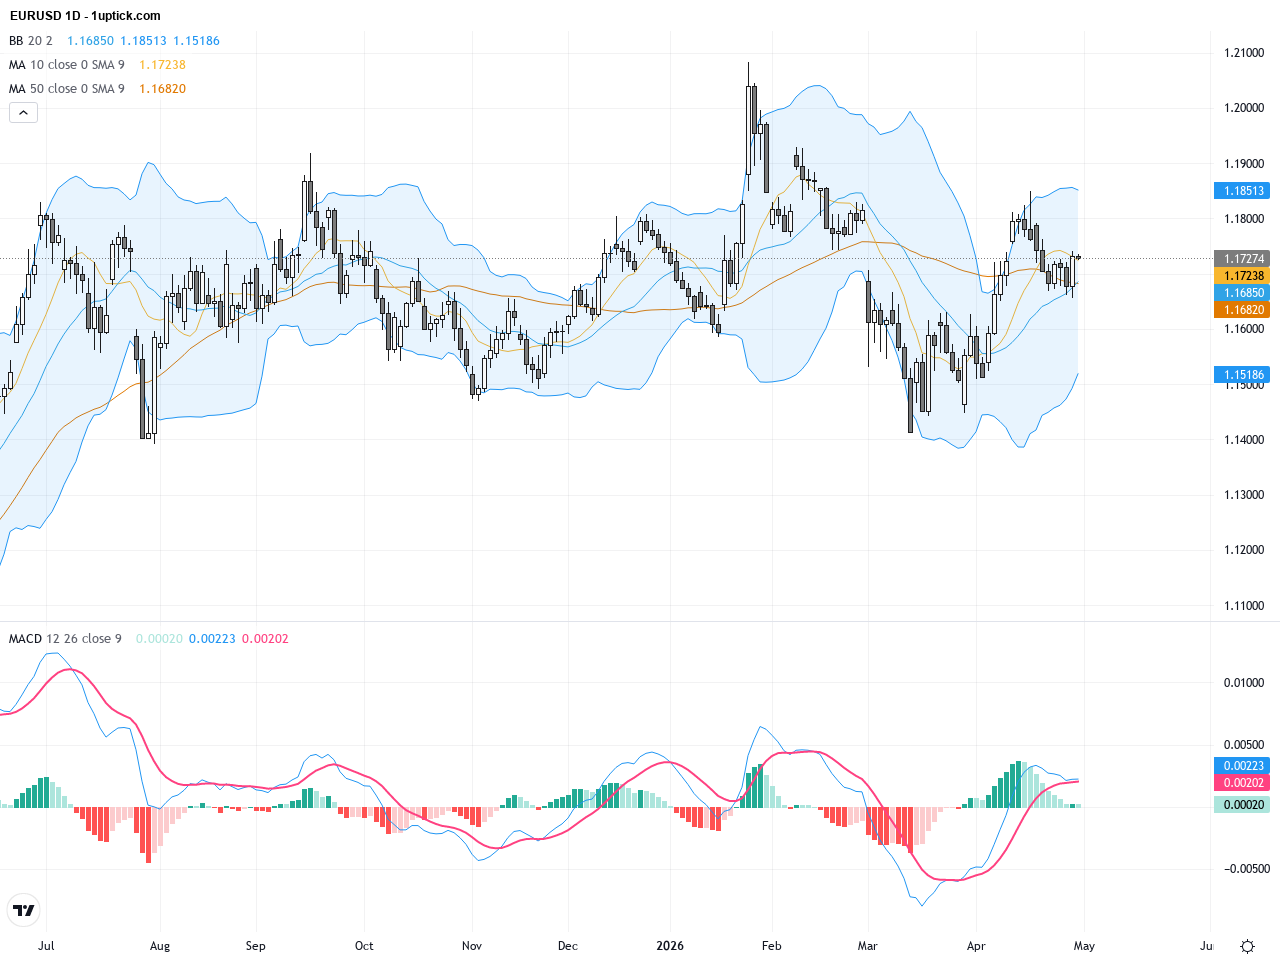
The daily chart of EURUSD shows a clear recovery from recent lows around 1.1665, with prices comfortably above the 50-day (1.16167) and 200-day (1.16803) moving averages, indicating a medium to long-term uptrend. The Bollinger Bands are expanding after a period of contraction, signaling rising volatility. The MACD indicator has formed a golden cross, suggesting bullish momentum building for the days ahead. Overall, the trend is shifting from a corrective phase to a bullish one, contingent on holding above the 1.1700 level to confirm further upward movement.
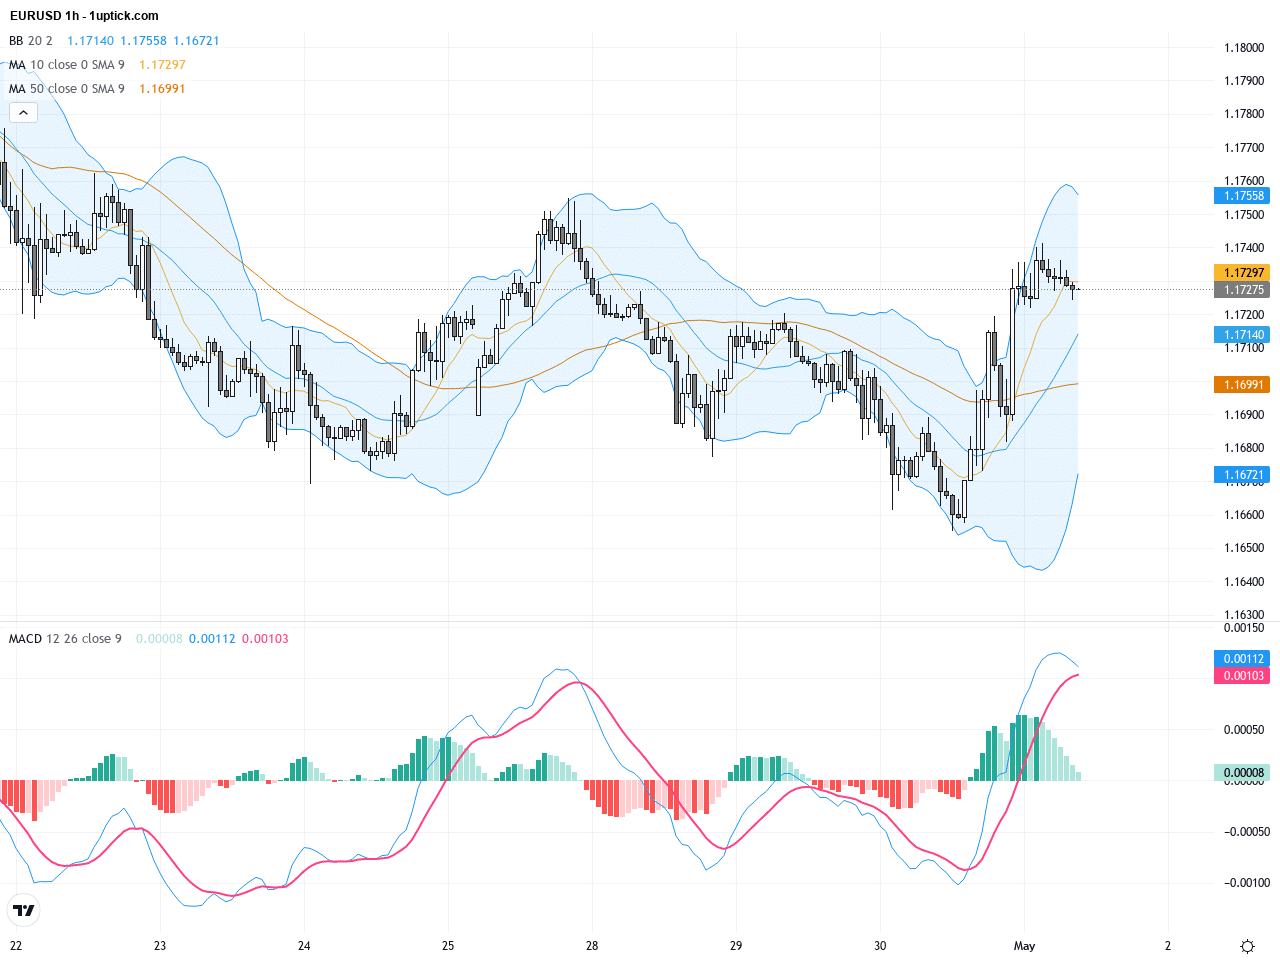
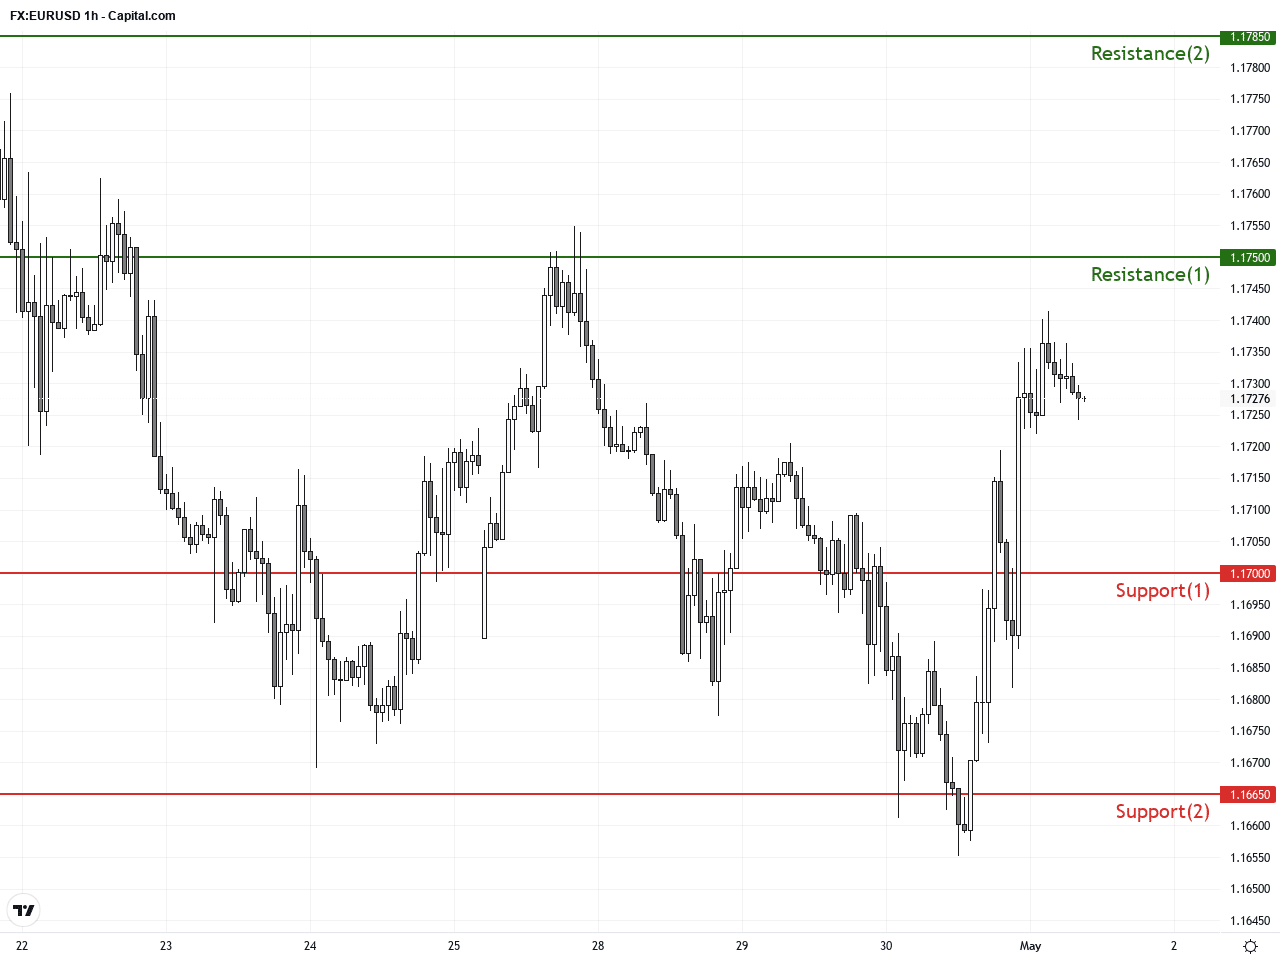
On the 5-day hourly chart, EURUSD has been consolidating around the 1.1700 level. Bollinger Bands show slight contraction implying balance between buyers and sellers. Short-term moving averages (5-hour and 10-hour) converge near 1.172, creating a support zone. The MACD line recently crossed above its signal line, indicating short-term bullish momentum. A forming flag pattern suggests a possible breakout soon, with an upward move potentially challenging highs near 1.1750.
Technical Trend: Cautiously bullish consolidating uptrend
Technically, the EURUSD daily MACD golden cross confirms bullish momentum, while a short-term flag pattern is developing, waiting for a breakout confirmation. Holding the 1.1700 support is critical for a positive bias. Hourly MACD supports short-term buying pressure. The recent price recovery and the potential breakout above 1.1750 resistance could attract fresh buying interest. Watch for volume changes and price action breaking above the flag’s upper boundary to seize trading opportunities.Today’s economic calendar in GMT+1 features key US manufacturing PMI and ISM manufacturing indices later in the day, which are most relevant to EURUSD. Stronger-than-expected US data would likely strengthen the dollar, pressuring EURUSD lower. Conversely, weaker data could favor the euro. Other releases from Japan and Australia are unlikely to have any significant direct impact on EURUSD. With no major direct eurozone data scheduled today, traders should focus on these US reports for short-term directional cues.
Resistance & Support
The above financial market data, quotes, charts, statistics, exchange rates, news, research, analysis, buy or sell ratings, financial education, and other information are for reference only. Before making any trades based on this information, you should consult independent professional advice to verify pricing data or obtain more detailed market information. 1uptick.com should not be regarded as soliciting any subscriber or visitor to execute any trade. You are solely responsible for all of your own trading decisions.