 |
| Gold V.1.3.1 signal Telegram Channel (English) |

GBPUSD Trading Outlook: Political Uncertainty Weighs on Sterling with Key Technical Support Levels in Play
2026-02-27 @ 13:02
Over the past 24 to 48 hours, the GBP/USD pair has experienced a downward volatility trend, dropping from yesterday’s close of 1.34958 to around 1.3485. This movement is largely driven by escalating political uncertainty in the UK ahead of the Manchester local elections. Investor hesitation is fueling a decline in market confidence for the Pound. Additionally, persistent inflation in the UK services sector and the release of the latest U.S. Producer Price Index (PPI) data have led traders to favor the U.S. dollar, boosting the dollar index and pressuring the GBP/USD exchange rate downward.
For the average investor, this situation resembles a high-stakes multiple choice test filled with unknown political variables. On one hand, the election outcomes will significantly affect the UK’s economic policy direction; on the other hand, stronger US inflation data has bolstered the dollar’s appeal, diminishing the Pound’s attractiveness. Thus, amid the intertwined impacts of policy uncertainties and economic data, GBP/USD’s recent movement reflects the market’s cautious stance on future risks.
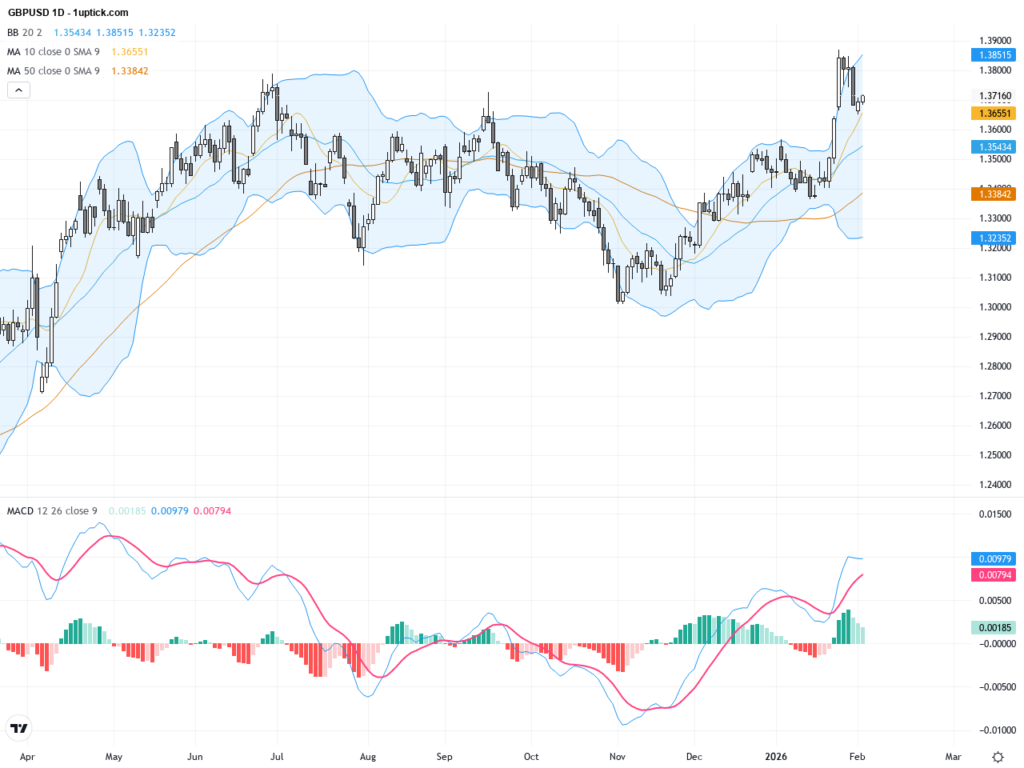
The GBPUSD daily chart reveals recent consolidation between 1.3400 and 1.3550, but an overall bearish tilt. After peaking near 1.38688 at the start of the year, prices repeatedly failed to breach the 50-day moving average (~1.35471), indicating weakening medium-term upside momentum. Bollinger Bands are contracting, signaling reduced volatility, while the MACD shows a bearish crossover hinting at possible trend reversal. The daily chart suggests GBPUSD faces key moving average resistance and remains vulnerable to further downside moves.
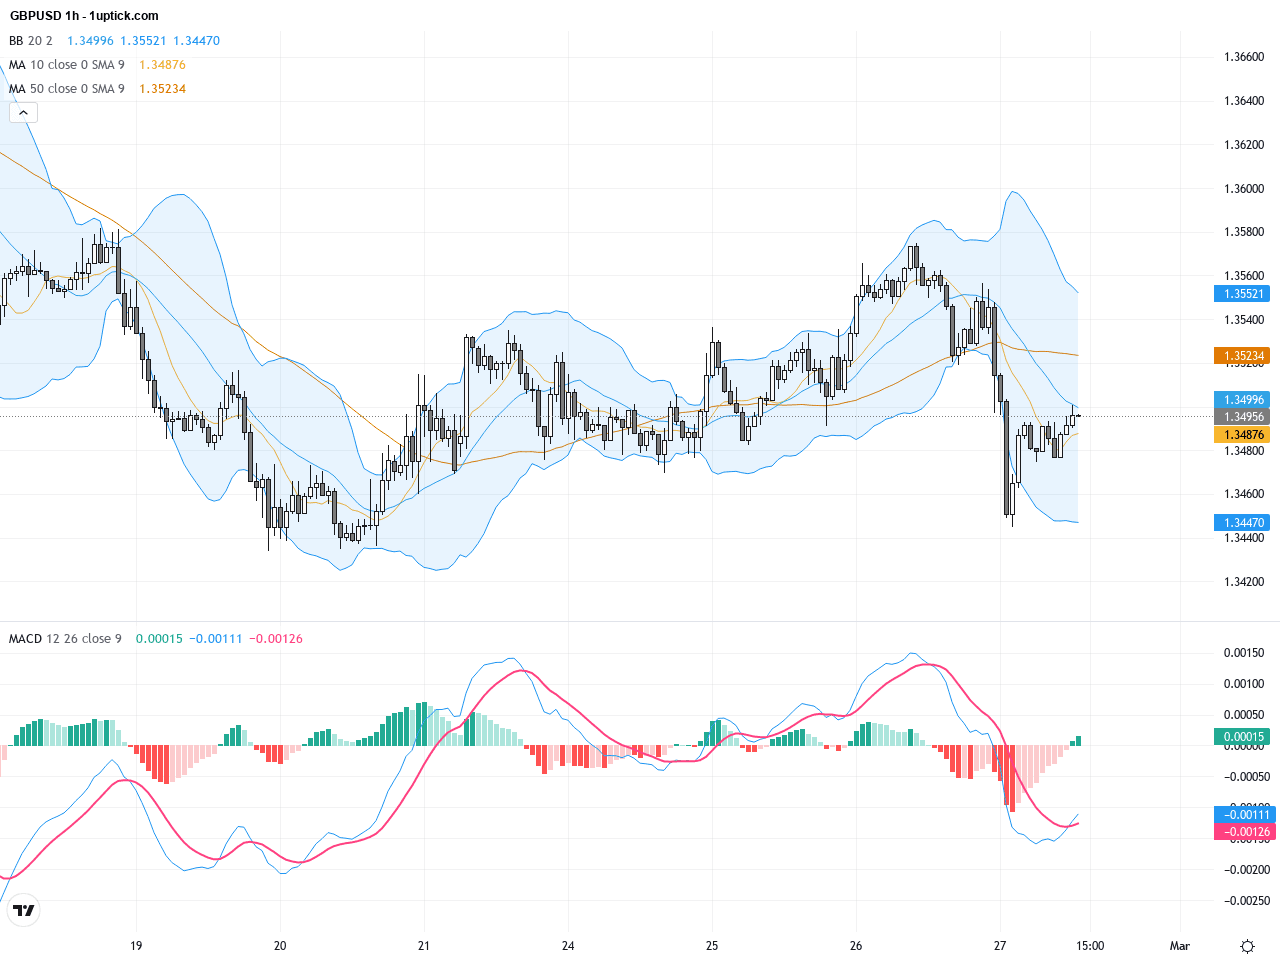
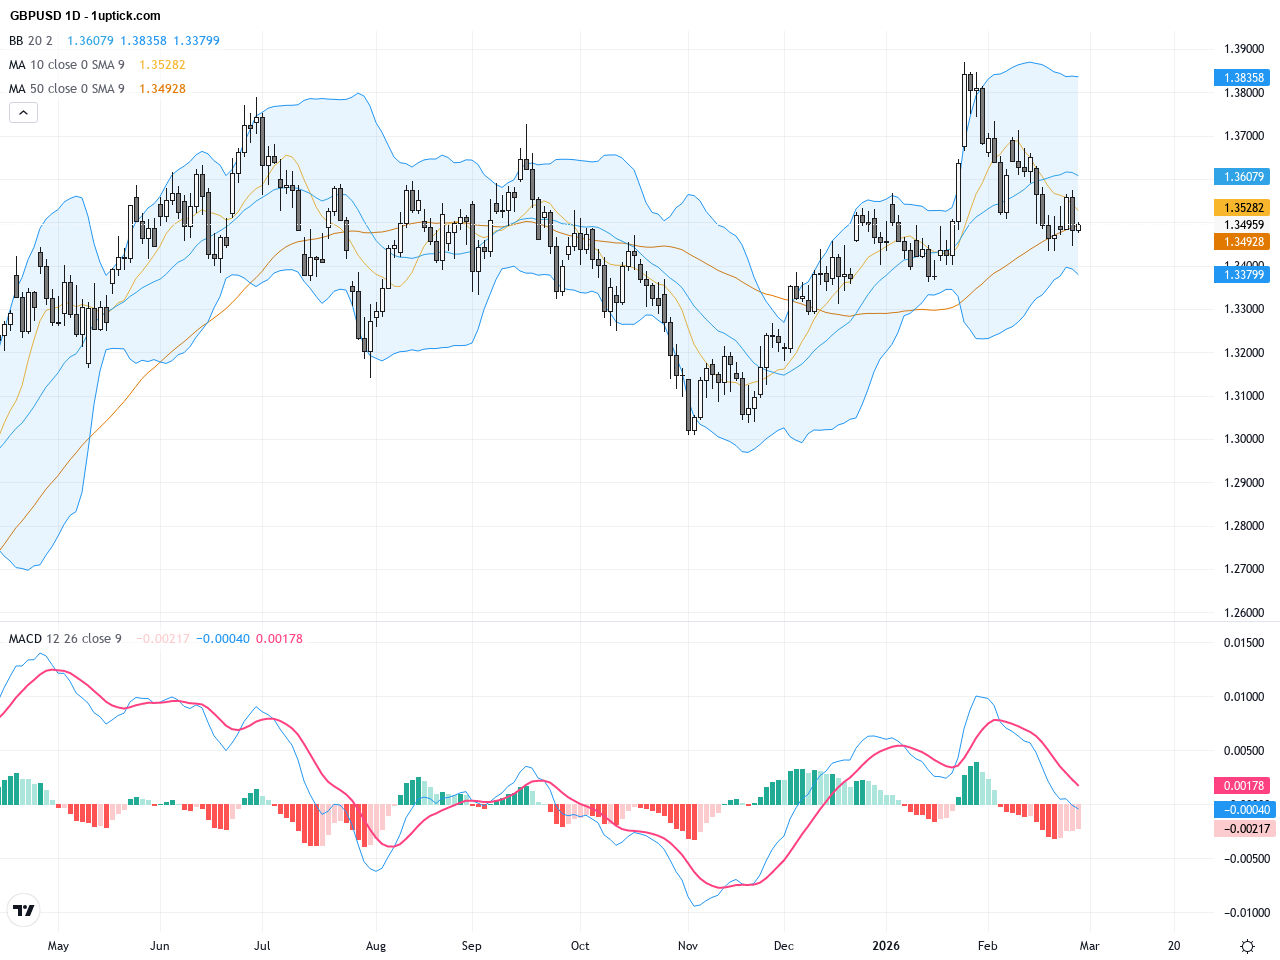
The past five days on the hourly chart show GBPUSD gradually declining from a 1.3550 high, with prices crossing below short-term moving averages. The Bollinger Bands are tightening and price is moving closer to the lower band, indicating mounting short-term selling pressure. The MACD histogram is increasingly negative with a bearish signal line crossover below zero. Recent candlesticks formed hammer patterns with long lower shadows, possibly indicating short-term bounce potential, though bearish sentiment dominates overall.
Technical Trend: The overall trend from a technical perspective is cautiously bearish, with clear downside pressure but some room for short-term rebounds.
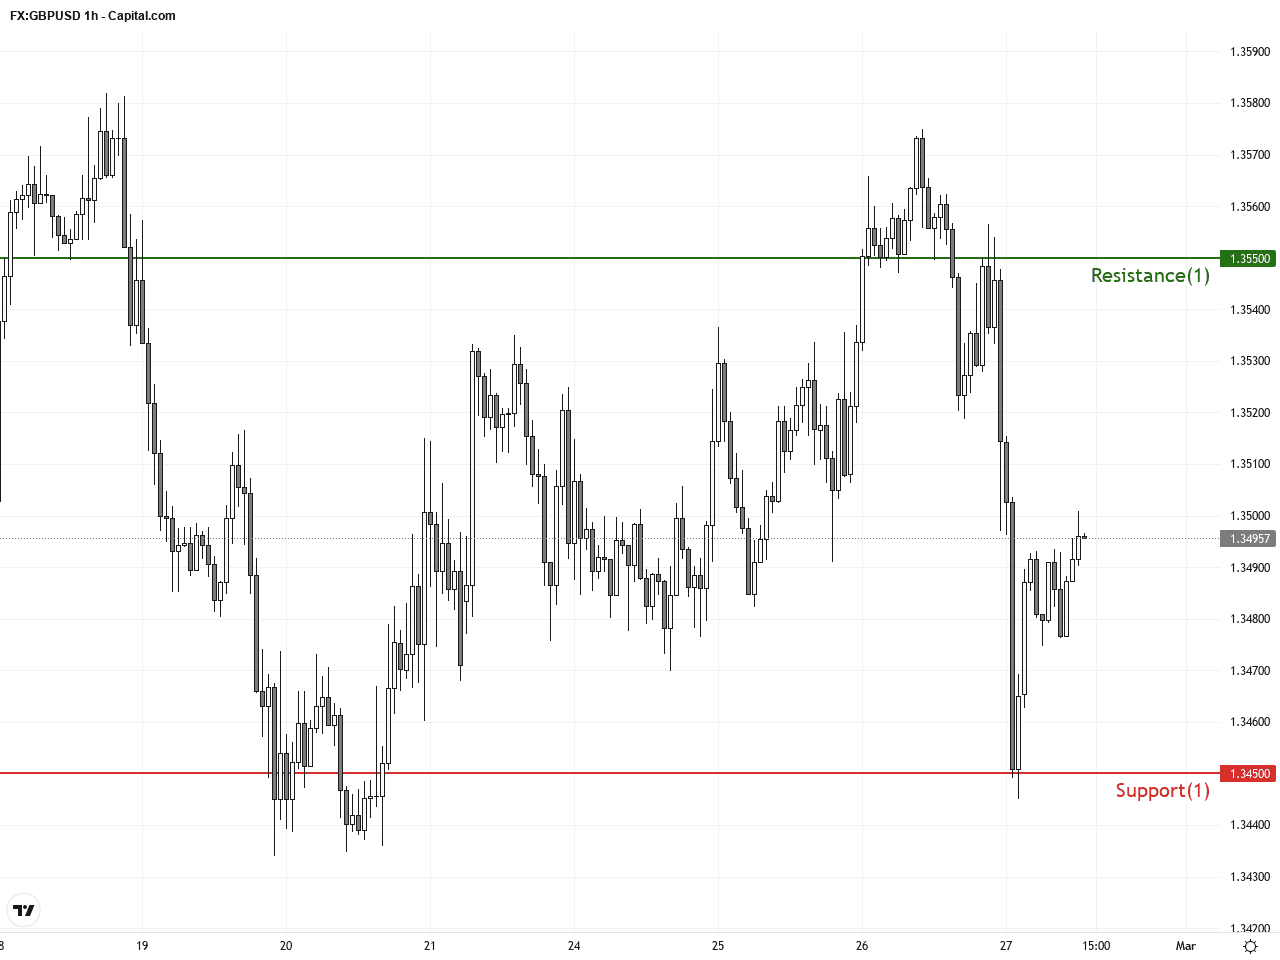
Key technical insights include the daily MACD bearish crossover and Bollinger Band narrowing with price resistance near the 50-day moving average. The hourly chart shows bearish alignment with intermittent hammer candlesticks signaling short-term indecision. Watching the critical support around 1.3450 is essential; a break below could prolong the downtrend. Increased volume recently suggests growing bearish momentum. Traders should be cautious and monitor the US inflation data for immediate impact cues.Today’s economic calendar does not feature any major UK or US events that would directly impact GBPUSD immediately. Data releases from Japan, Australia, and Europe are scheduled but have limited direct influence on the pair. Market participants should keep an eye on the upcoming US Producer Price Index at 14:30 GMT+1, which is expected to continue signaling easing inflation, potentially favoring the US dollar and indirectly impacting GBPUSD price action.
Resistance & Support
The above financial market data, quotes, charts, statistics, exchange rates, news, research, analysis, buy or sell ratings, financial education, and other information are for reference only. Before making any trades based on this information, you should consult independent professional advice to verify pricing data or obtain more detailed market information. 1uptick.com should not be regarded as soliciting any subscriber or visitor to execute any trade. You are solely responsible for all of your own trading decisions.