


 |
| Gold V.1.3.1 signal Telegram Channel (English) |
USDCAD: Key Resistance and Trading Outlook Post U.S. Tariff Policy Shift
2026-02-24 @ 13:02
Over the past 24 to 48 hours, USD/CAD experienced modest fluctuations, closing yesterday at 1.37071. The U.S. Dollar Index retreated as the U.S. Supreme Court ruled on tariff policy, directly weighing on the dollar against the Canadian dollar. The Court struck down key tariffs implemented during the Trump administration, prompting investors to reassess the trade outlook between the two nations.
At the same time, Canada’s narrower trade deficit in December alongside rising oil prices provided support to the Canadian dollar, boosting its demand. In this context, while USD/CAD saw a slight pullback in the short term, the broader bullish dollar trend remains intact. This indicates that despite the dollar’s relative strength, it faces headwinds from policy verdicts and economic data.
For the average investor, this scenario highlights how international politics and trade policies can quickly sway currency movements: a court decision or policy shift can alter bilateral economic expectations and directly impact currency prices. Investors should closely watch U.S. trade policies and Canadian economic indicators, as these are key drivers behind USD/CAD price dynamics.

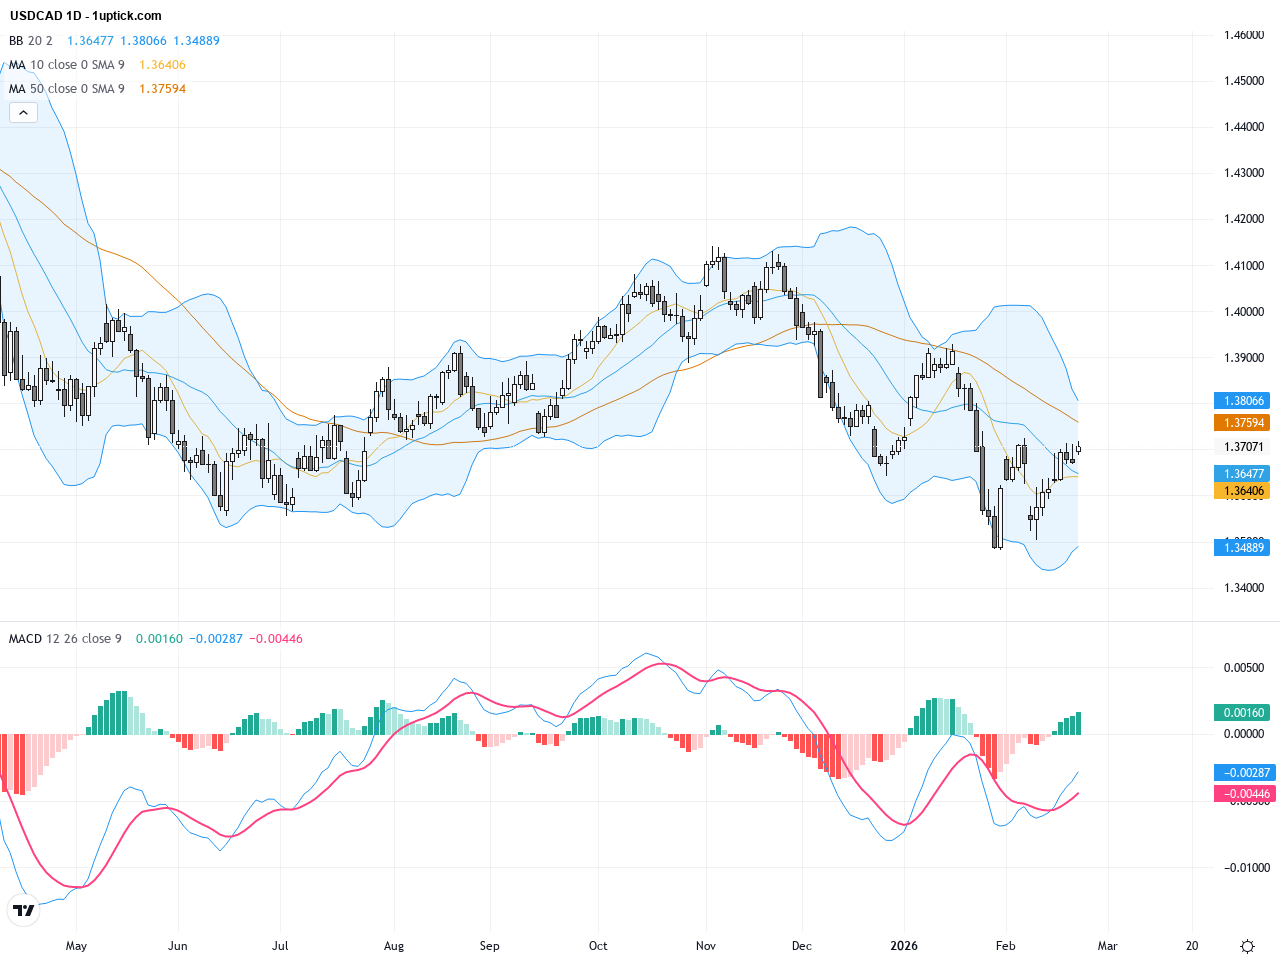
Analyzing the daily chart, USDCAD exhibits a steady upward trend from the year’s low at 1.34813, recently reaching a high near 1.37173. The 20-day EMA continues to offer solid support below price, while the 200-day EMA remains overhead acting as resistance. The Bollinger Bands are narrowing, indicating reduced volatility. MACD shows waning bullish momentum, yet no bearish cross has appeared, suggesting the overall technical condition remains skewed bullish aided by fundamental tailwinds.
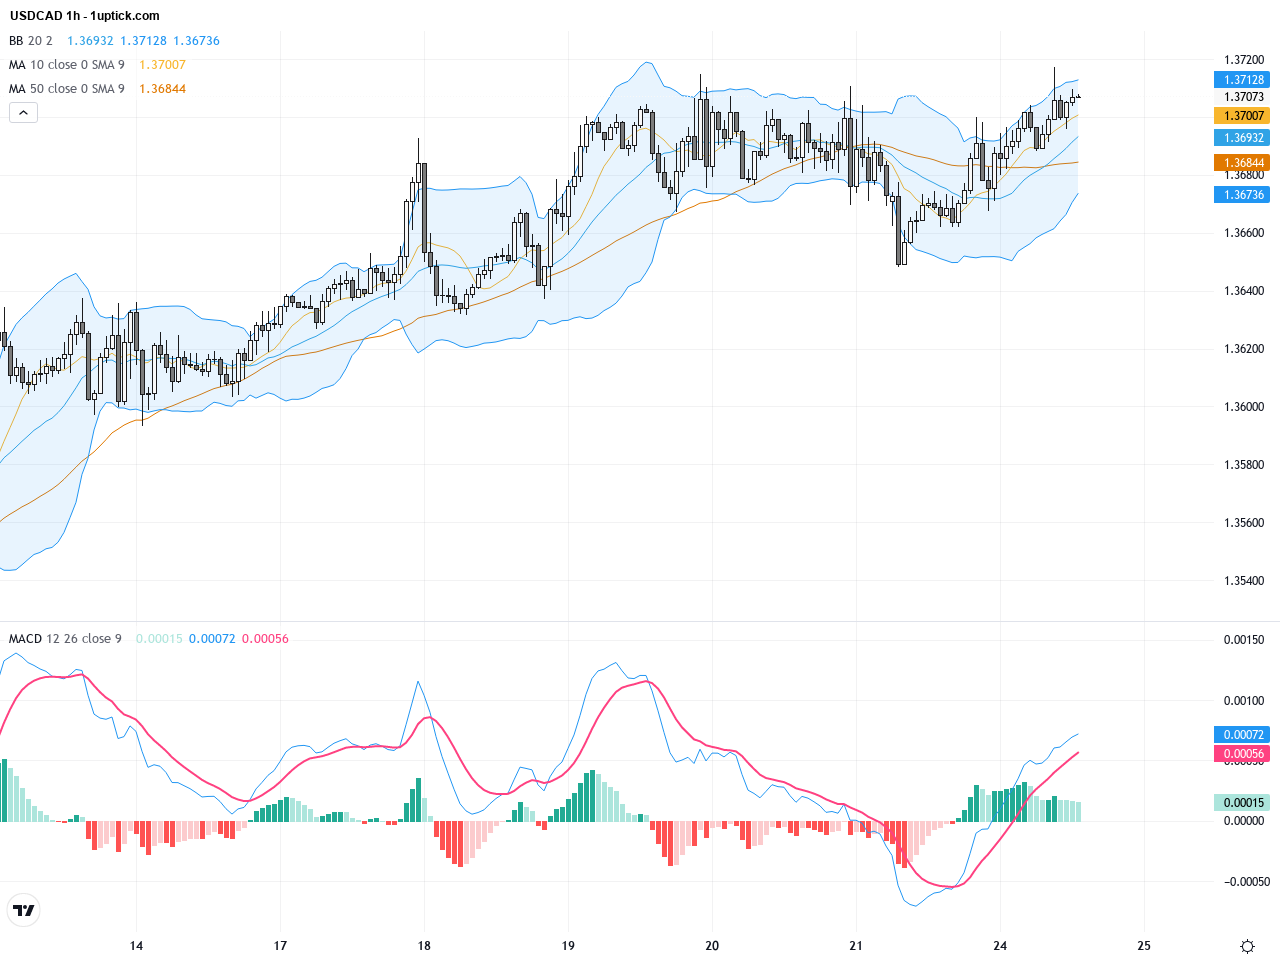
In the last 3-5 days on the hourly chart, USDCAD shows sideways consolidation between approximately 1.3688 and 1.3720. Price has repeatedly tested but failed to break above the 20-period EMA, indicating near-term weakness. The Bollinger Bands middle line caps gains, while MACD lines show a faint crossover pattern hinting at potential short-term correction. This price action reflects a balance of supply and demand forces, warranting close attention to any breakout for directional clarity.
Technical Trend: Overall trend is cautiously bullish with signs of consolidative sideways movement, reflecting market indecision and near-term corrective potential.
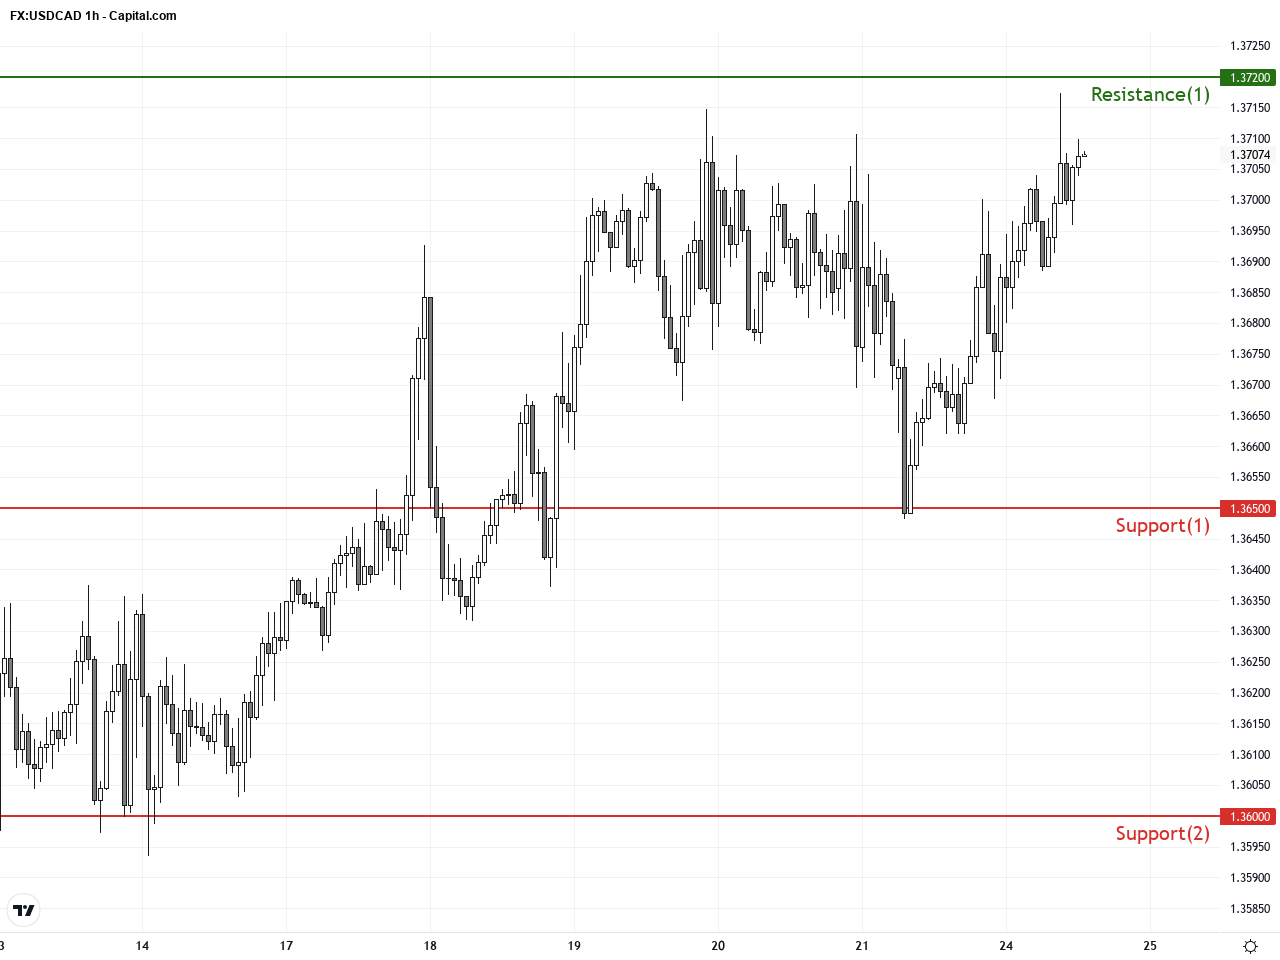
Technically, USDCAD is consolidating between critical support at 1.3650 and resistance near 1.3720. The daily chart’s price holding around the 20-day EMA implies ongoing short-term buying interest, though MACD momentum has eased. Hourly MACD approaches a bearish crossover, signaling possible short-term pullback. Recently formed doji candlestick highlights indecision among traders. For now, cautious trading is advisable awaiting a confirmed breakout or breakdown.No significant or directly relevant economic events impacting USDCAD are scheduled today in the GMT+1 time zone. However, multiple FOMC members are scheduled to speak during the North American session, which could inject volatility into the U.S. dollar. Additionally, the Crude Oil Stocks (API) weekly change report at 22:40 GMT+1 is a key data point — better-than-expected inventory draws support CAD, while weaker data could weigh on it. Thus, today’s market reaction in USDCAD hinges largely on U.S. Fed commentary and oil market moves.
Resistance & Support
The above financial market data, quotes, charts, statistics, exchange rates, news, research, analysis, buy or sell ratings, financial education, and other information are for reference only. Before making any trades based on this information, you should consult independent professional advice to verify pricing data or obtain more detailed market information. 1uptick.com should not be regarded as soliciting any subscriber or visitor to execute any trade. You are solely responsible for all of your own trading decisions.
Latest Technical Analysis
Latest Insightz