


 |
| Gold V.1.3.1 signal Telegram Channel (English) |

AUDUSD: Bullish Momentum Supported by Strong Jobs Data and Technical Patterns
2026-02-23 @ 06:01
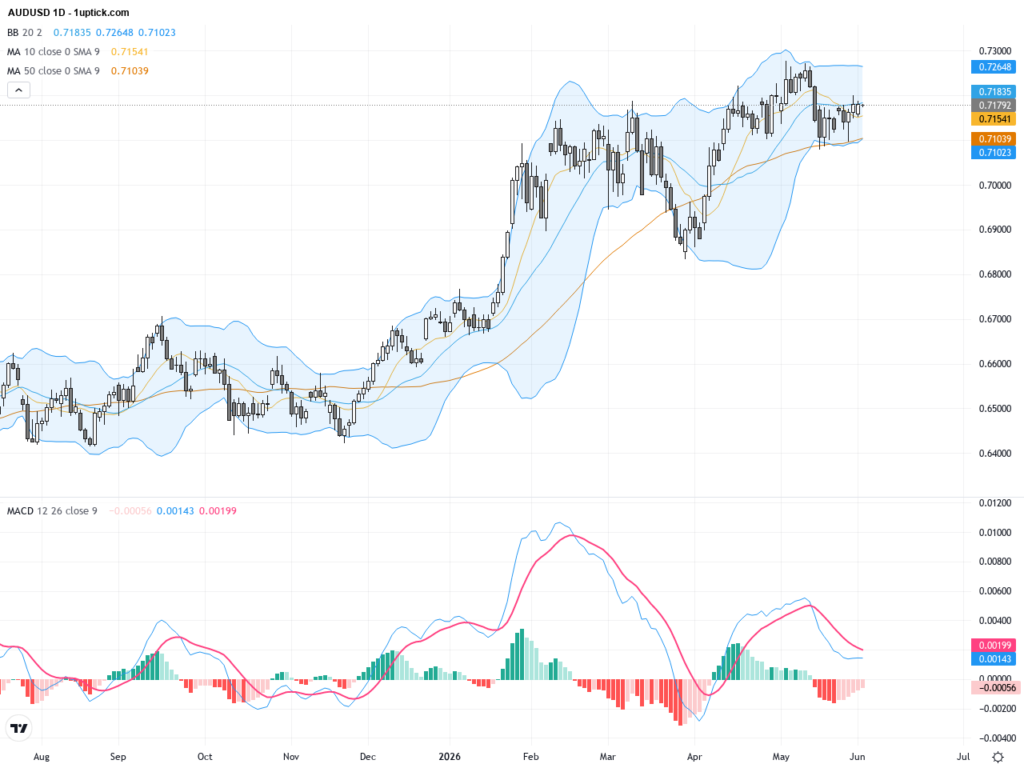
Over the past 24 to 48 hours, the AUD/USD pair experienced mild fluctuations, closing yesterday at 0.70742. The overall movement reflects investors’ cautious stance ahead of the upcoming U.S. inflation data release. Asian currencies, including the Australian dollar, remained subdued, especially after Japan’s soft CPI reading raised concerns about the Bank of Japan’s future policy outlook, indirectly affecting the AUD.
Meanwhile, the U.S. dollar showed strength recently, compounded by weaker domestic PMI data from Australia, putting pressure on AUD/USD. However, upbeat Australian employment figures released last Thursday helped the Aussie regain some ground, bolstering expectations of further rate hikes by the Reserve Bank of Australia (RBA).
For everyday investors, these developments highlight how policy decisions and economic data can directly influence exchange rates. As U.S. inflation figures loom, a stronger dollar is typical, which tends to weigh on the Australian dollar. Conversely, improving Australian employment data imply that the economy remains resilient, providing support for AUD. In other words, the market is navigating a fine balance amid a complex mix of economic factors, urging investors to stay alert for new data to guide trading strategies.

The daily chart illustrates a sustained uptrend in AUDUSD since the start of the year, with price firmly above both the 50-day and 200-day moving averages, signaling strong medium-to-long-term bullish momentum. The Bollinger Bands are widening, suggesting increased volatility potential. The MACD remains above zero with positive momentum, reinforcing the bullish bias. Overall, the intermediate trend favors further upside, though correction risks should be monitored.
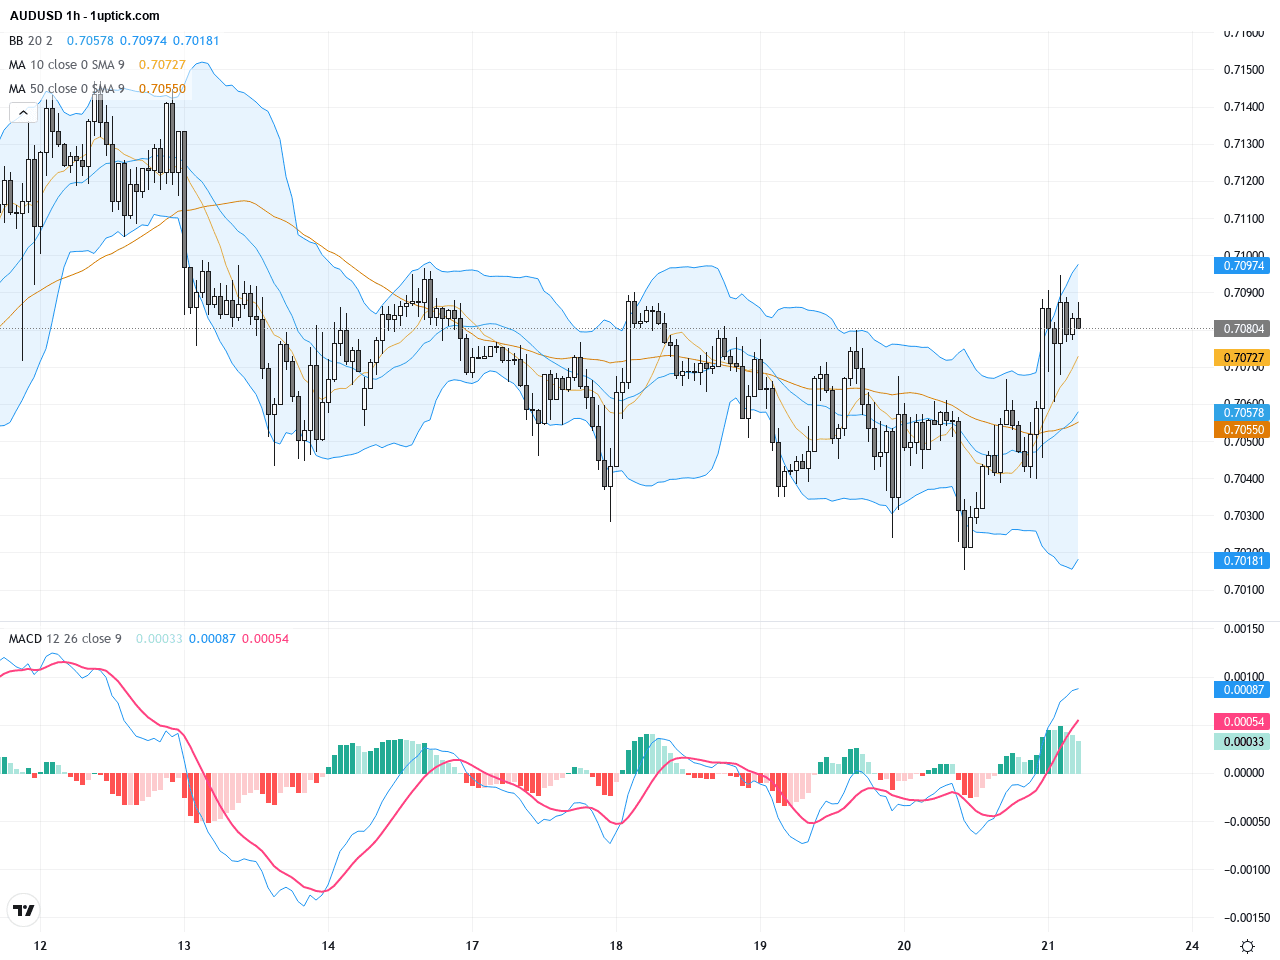
On the 1-hour chart, AUDUSD has shown a rising consolidation over the past 3-5 days, trading near the mid-Bollinger Band with short-term moving averages crossing bullishly. An ascending triangle pattern has developed since February 19, implying increased chances of an upside breakout. However, a recent MACD bearish divergence warns of possible short-term retracement. The latest notable candlestick is a bullish engulfing pattern, indicating strong buyer pressure in the next 24 hours.
Technical Trend: AUDUSD is currently in a clearly bullish trend with an optimistic directional bias.
Key technical insights show that AUDUSD’s bullish trend remains well-supported, with daily chart golden crosses and positive MACD readings underscoring strong buying interest. The short-term ascending triangle pattern signals a probable upward breakout, but MACD bearish divergence warns of potential pullbacks. Traders are advised to consider long entries near support levels to capitalize on trend continuation while managing downside risk.Today’s economic calendar features New Zealand’s Retail Sales for Q4 at 22:45 GMT+1. While indirectly influencing the AUD, the data is expected to align with previous figures and is unlikely to have a significant direct impact on AUDUSD today. Thus, no major economic events are set to directly move AUDUSD at this time.
Resistance & Support

The above financial market data, quotes, charts, statistics, exchange rates, news, research, analysis, buy or sell ratings, financial education, and other information are for reference only. Before making any trades based on this information, you should consult independent professional advice to verify pricing data or obtain more detailed market information. 1uptick.com should not be regarded as soliciting any subscriber or visitor to execute any trade. You are solely responsible for all of your own trading decisions.