


 |
| Gold V.1.3.1 signal Telegram Channel (English) |
AUDUSD: AI Commodity Boom Drives Australian Dollar Rally with Key Technical Patterns in Play
2026-03-25 @ 06:02
Over the past 24 to 48 hours, the AUD/USD (Australian Dollar to US Dollar) pair experienced notable volatility, with prices oscillating around yesterday’s closing level of 0.69939. Key drivers included escalating tensions in the Strait of Hormuz, which sparked a surge in US Dollar safe-haven demand, briefly pushing AUD/USD below the 0.7000 support level and pressuring the Australian Dollar amid heightened market risk aversion.
However, as the situation eased and the US along with its allies took measures to enhance security and shipping supply through the Strait, the Australian Dollar recovered, climbing back near the 0.7090 level. This rebound reflected underlying confidence in Australia’s economy and commodity exports. Barclays’ recent upgrade of the Australian Dollar forecast, citing a commodity boom driven by artificial intelligence advancements, further strengthened AUD’s appeal as a commodity-linked currency.
For everyday investors, this market action serves as a reminder of how swiftly geopolitical events and economic shifts can influence forex markets. Moreover, strong Australian economic data and hints from the Reserve Bank of Australia about possibly prolonged tightening policies provide potential upside support for the AUD moving forward, making it an asset worth monitoring closely.

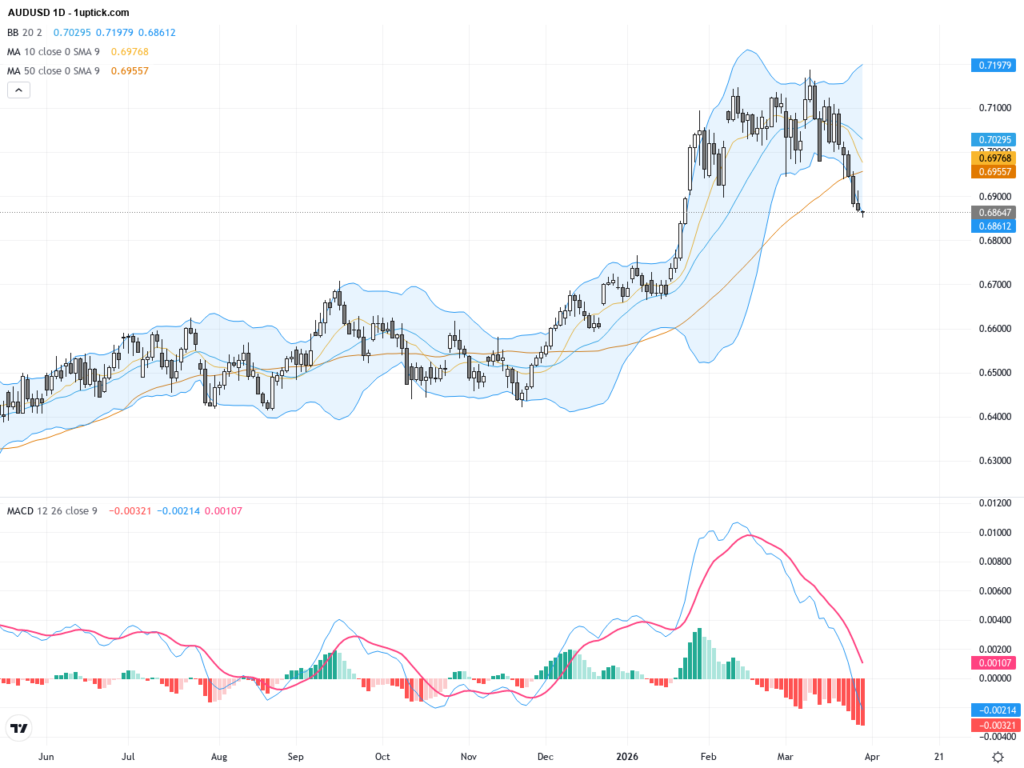
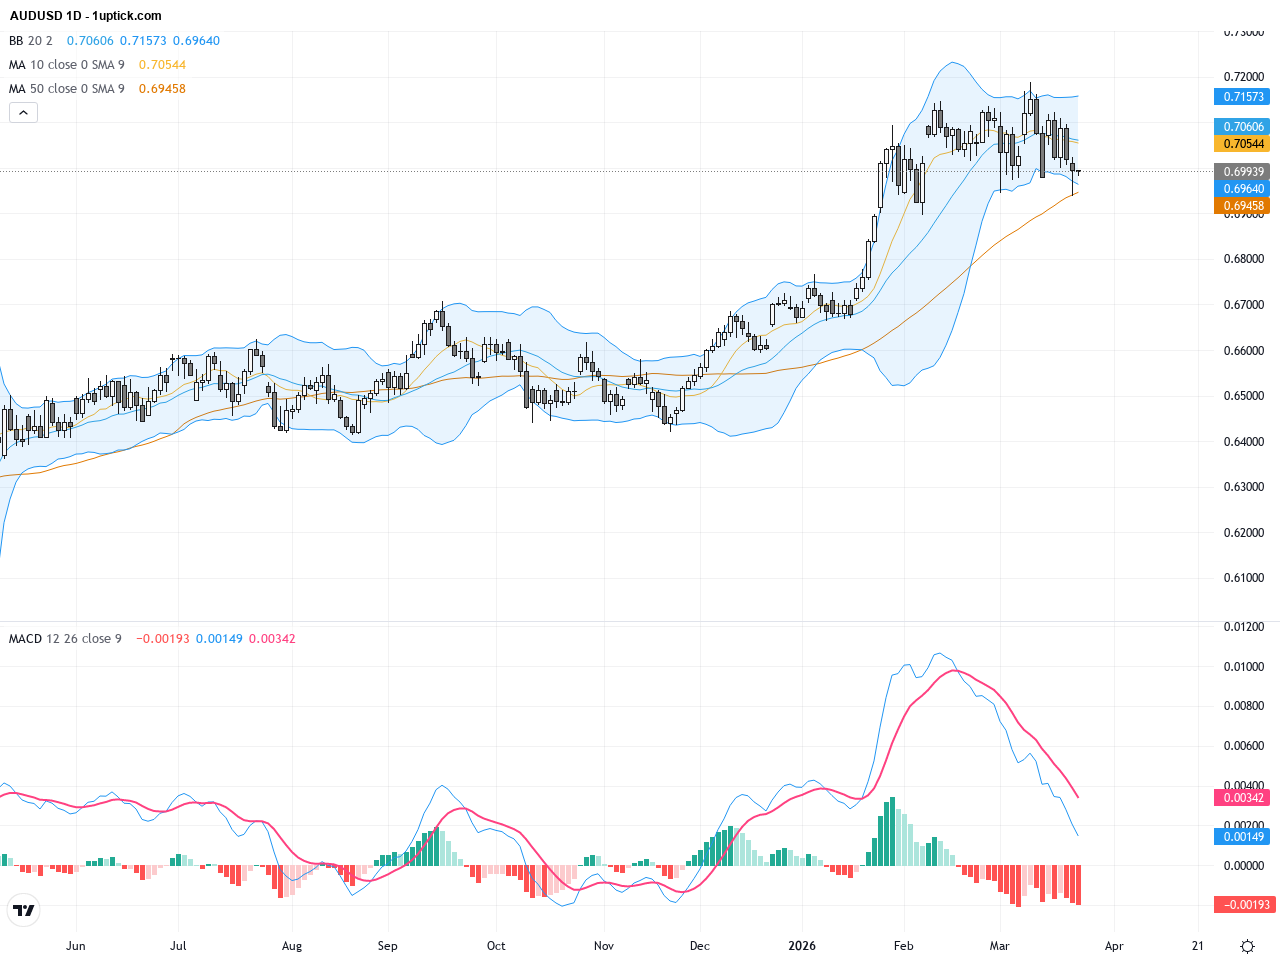
The daily chart depicts AUDUSD gradually recovering from recent lows near 0.691, showing a gentle uptrend. The pair’s price remains mostly above the 50-day moving average (0.7043) and well above the 200-day moving average (0.6696), indicating medium-to-long term bullish momentum. Bollinger Bands have tightened, signaling reduced volatility but a likely upcoming directional move. The MACD is positive with increasing momentum, reinforcing the bullish bias. Critical resistance lies between 0.7125 and 0.7150; a successful breakout there could open more upside potential.

The hourly chart over the last 3–5 days shows AUDUSD consolidating within a 0.7050–0.7120 range. Short-term moving averages are aligned upwards with the price near the Bollinger middle band. The MACD histogram shows alternating positive and negative readings, reflecting choppy momentum. A recent bullish engulfing candlestick pattern suggests the possibility of further short-term upward movement. However, a drop below 0.7000 may test short-term support and signal more consolidation or downside risk.
Technical Trend: Cautiously bullish with steady upward momentum
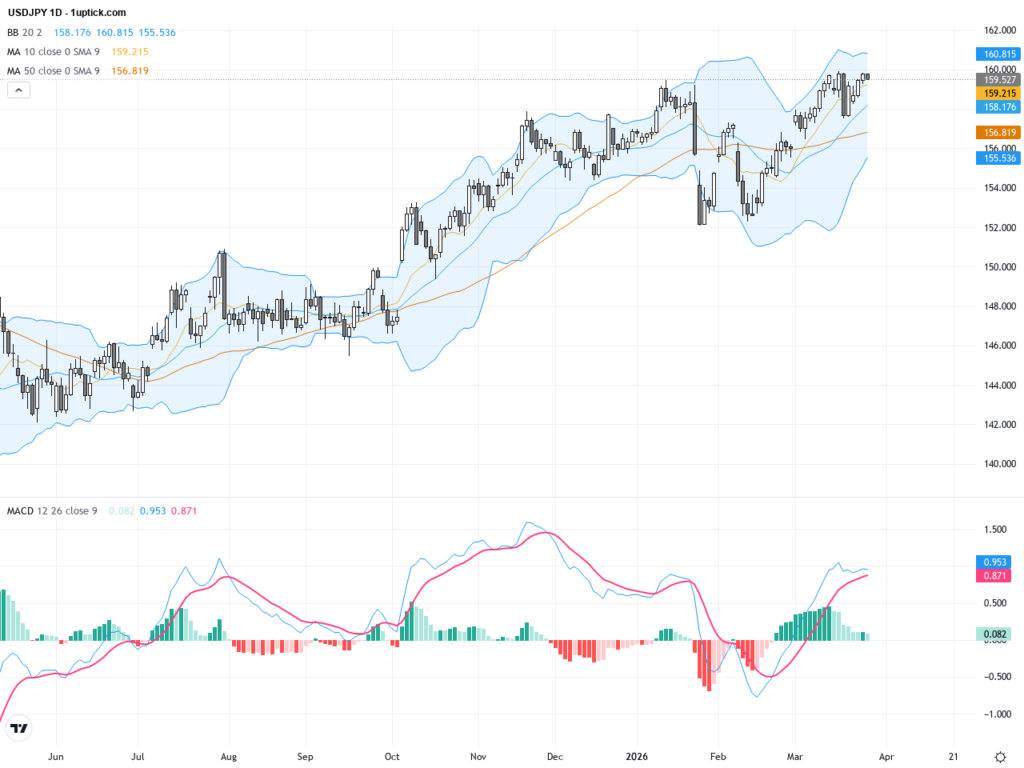
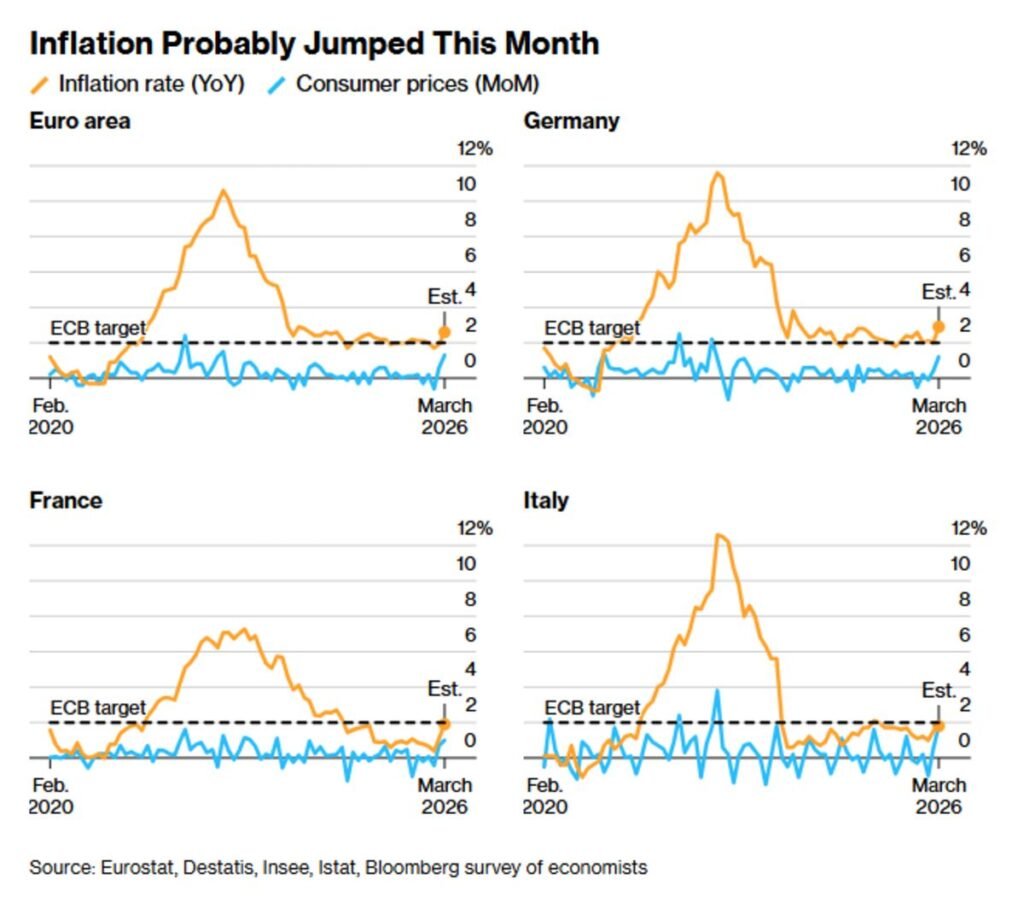
From a technical perspective, AUDUSD shows a solid bullish trend on the daily chart with strong support at the 50-day moving average and positive MACD momentum indicating increasing buyer interest. The short-term hourly chart’s bullish engulfing pattern reinforces near-term upside potential. The emerging flag-like consolidation pattern suggests a continuation of the upward trend upon a decisive breakout. With volume and momentum indicators confirming strength, traders should watch for price to hold above the 0.7000 support level to validate sustained buying pressure and a potential trading opportunity.Today’s economic calendar highlights several data releases from Japan, Europe, and the US that bear indirect relevance to AUDUSD. Japanese CPI and manufacturing PMI came in slightly below forecasts but will have limited direct impact on AUDUSD. Eurozone and US manufacturing and services PMIs are scheduled for later, and stronger-than-expected prints could weigh on the USD, indirectly supporting AUDUSD gains. Overall, no immediate high-impact events directly related to AUDUSD are expected today, allowing traders to focus on broader market sentiment and technical factors.
Resistance & Support

The above financial market data, quotes, charts, statistics, exchange rates, news, research, analysis, buy or sell ratings, financial education, and other information are for reference only. Before making any trades based on this information, you should consult independent professional advice to verify pricing data or obtain more detailed market information. 1uptick.com should not be regarded as soliciting any subscriber or visitor to execute any trade. You are solely responsible for all of your own trading decisions.