


 |
| Gold V.1.3.1 signal Telegram Channel (English) |

AUDUSD: Navigating Middle East Risks Amid Key Support and Technical Patterns
2026-03-30 @ 06:01
Over the past 24 to 48 hours, the Australian Dollar against the US Dollar (AUD/USD) has experienced notable volatility, closing yesterday at 0.68646, reflecting a modest decline of approximately 0.28% from the previous day. The market’s fluctuations were primarily driven by uncertainty surrounding geopolitical tensions in the Middle East, especially the strained relations between the US and Iran, as well as concerns over shipping security in the Strait of Hormuz. These developments heightened risk aversion, strengthening the US Dollar while weighing on the Australian Dollar.
Additionally, the tech and industrial sectors have shown weakness, whereas oil prices have rebounded, creating a tug-of-war between risk-on and risk-off assets. Barclays recently upgraded its outlook for the Australian Dollar, citing domestic economic tailwinds and an AI-driven commodity boom as drivers for future gains. However, near-term geopolitical risks remain a significant dampener on AUD/USD momentum.
For everyday investors, this signifies that despite solid fundamental support from economic data and commodity prices, global political uncertainties and unclear US policy toward Iran remain key risk factors. It’s crucial for investors to stay vigilant and closely monitor international developments as these external shocks can quickly alter the trajectory of the Australian Dollar.
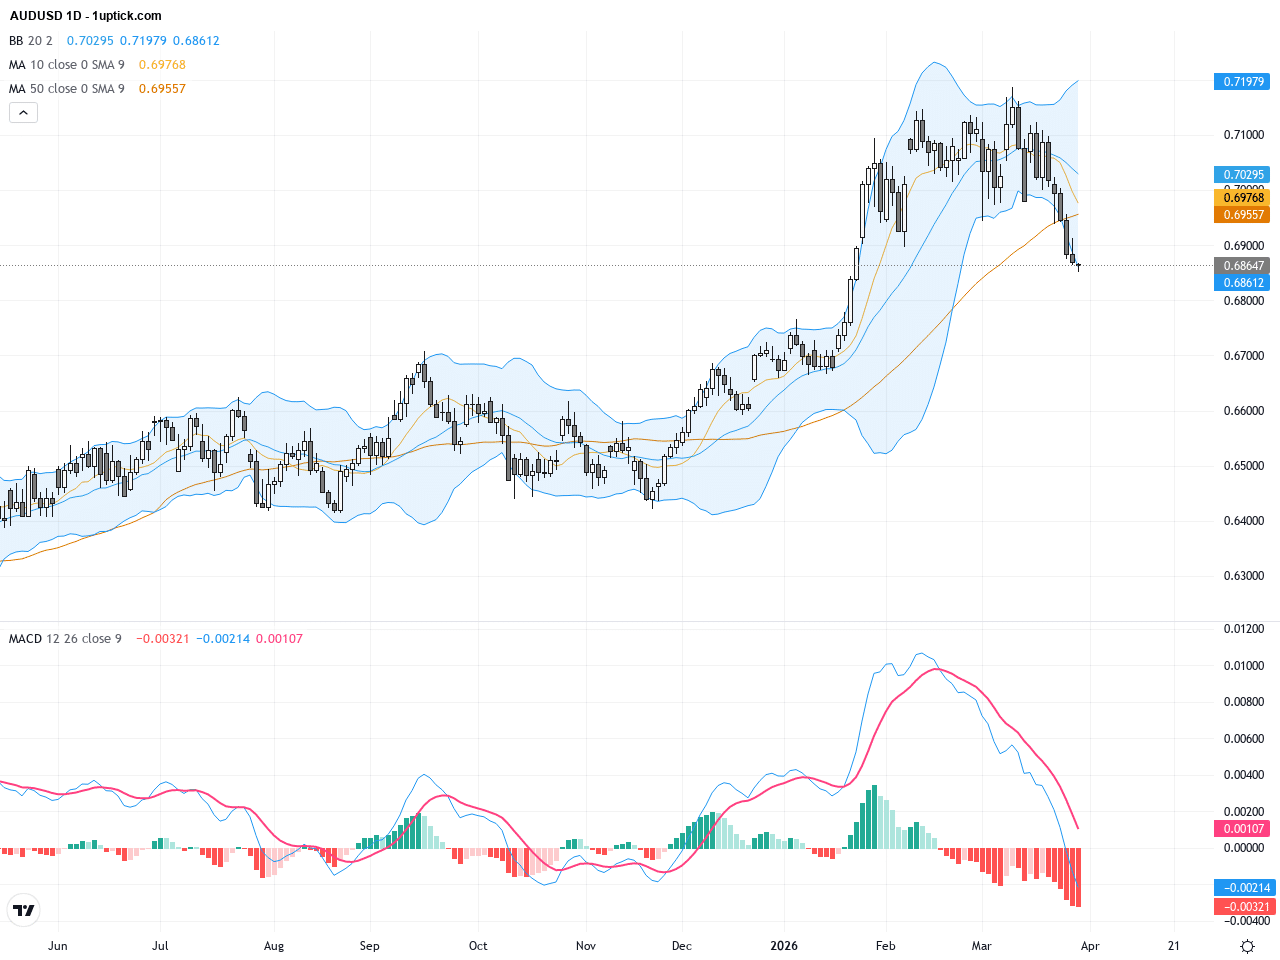
The daily chart reveals an overall downtrend for AUDUSD, with strong support around the 200-day moving average near 0.6704. Multiple attempts to breach the 50-day moving average at 0.7039 have failed, indicating persistent selling pressure. The Bollinger Bands are narrowing, pointing to reduced volatility and a potential upcoming breakout. The MACD remains in negative territory but shows contracting histogram bars, suggesting a possible short-term rebound. Overall, the daily view highlights a market in a corrective phase that still retains significant medium to long-term support, warranting caution against further downside risk.

The hourly chart over the last 3-5 days exhibits increased volatility, with price oscillating between 0.6850 and 0.6910. Short-term moving averages are intertwined, signaling a battle between bulls and bears. A bullish MACD crossover combined with price hitting the lower Bollinger Band suggests potential for a short-term bounce. The recent engulfing candlestick pattern underscores potential for buyers to regain some control, though confirmation from volume is needed. Key near-term support remains at 0.6850, which traders should watch closely as a breach could lead to further declines.
Technical Trend: The current trend is cautiously sideways with a slight bearish bias, yet technical indicators suggest room for a technical rebound, reflecting a volatile consolidation phase.
The most critical technical insight is the contracting MACD histogram on the daily chart and a bullish MACD crossover on the hourly, potentially signaling a short-term trend reversal. The dominant technical pattern resembles a flag consolidation, which, if broken decisively, could extend the prevailing trend. The recent engulfing candlestick on the hourly chart offers a tactical entry point, but volume confirmation is essential. Traders should use these signals to identify high-probability setups while maintaining strict risk controls.There are no significant or directly relevant economic events scheduled today that would impact AUDUSD. Market attention remains focused on geopolitical developments and commodity price movements, which are currently driving the pair’s volatility more than economic data releases. Traders should therefore prioritize news flow over today’s calendar events when assessing AUDUSD.
Resistance & Support

The above financial market data, quotes, charts, statistics, exchange rates, news, research, analysis, buy or sell ratings, financial education, and other information are for reference only. Before making any trades based on this information, you should consult independent professional advice to verify pricing data or obtain more detailed market information. 1uptick.com should not be regarded as soliciting any subscriber or visitor to execute any trade. You are solely responsible for all of your own trading decisions.