


 |
| Gold V.1.3.1 signal Telegram Channel (English) |

EURUSD: Downtrend Intensifies with Key Support and Middle East Geopolitical Risks in Focus
2026-03-23 @ 09:01
Over the past 24 to 48 hours, the EUR/USD pair experienced notable declines, dropping from yesterday’s closing price of 1.15711 to around 1.15458, a decrease of over 0.2%. This weakening was primarily driven by escalating geopolitical tensions in the Middle East, especially intensified confrontations between Iran and the United States. West Texas Intermediate (WTI) crude oil prices surged more than 3.5% over the weekend, highlighting a sharp energy market response to the conflict, which in turn exerted pressure on the euro.
Given Europe’s heavy reliance on imported oil and liquefied natural gas, the spike in energy costs raises inflation expectations and economic uncertainty within the Eurozone, further weakening the euro. Simultaneously, the US dollar remained firm, benefiting from safe-haven flows amid geopolitical unrest and a hawkish stance from the Federal Reserve, reinforcing demand for the dollar during this period.
For the average investor, this market turbulence can be likened to a sudden spike in energy prices triggered by unforeseen international developments, imposing extra cost burdens on the European economy and heightening currency depreciation risks. Investors should closely monitor ongoing Middle East developments and global energy price trends, as these factors will directly influence the EUR/USD exchange rate and related asset performance in the near term.
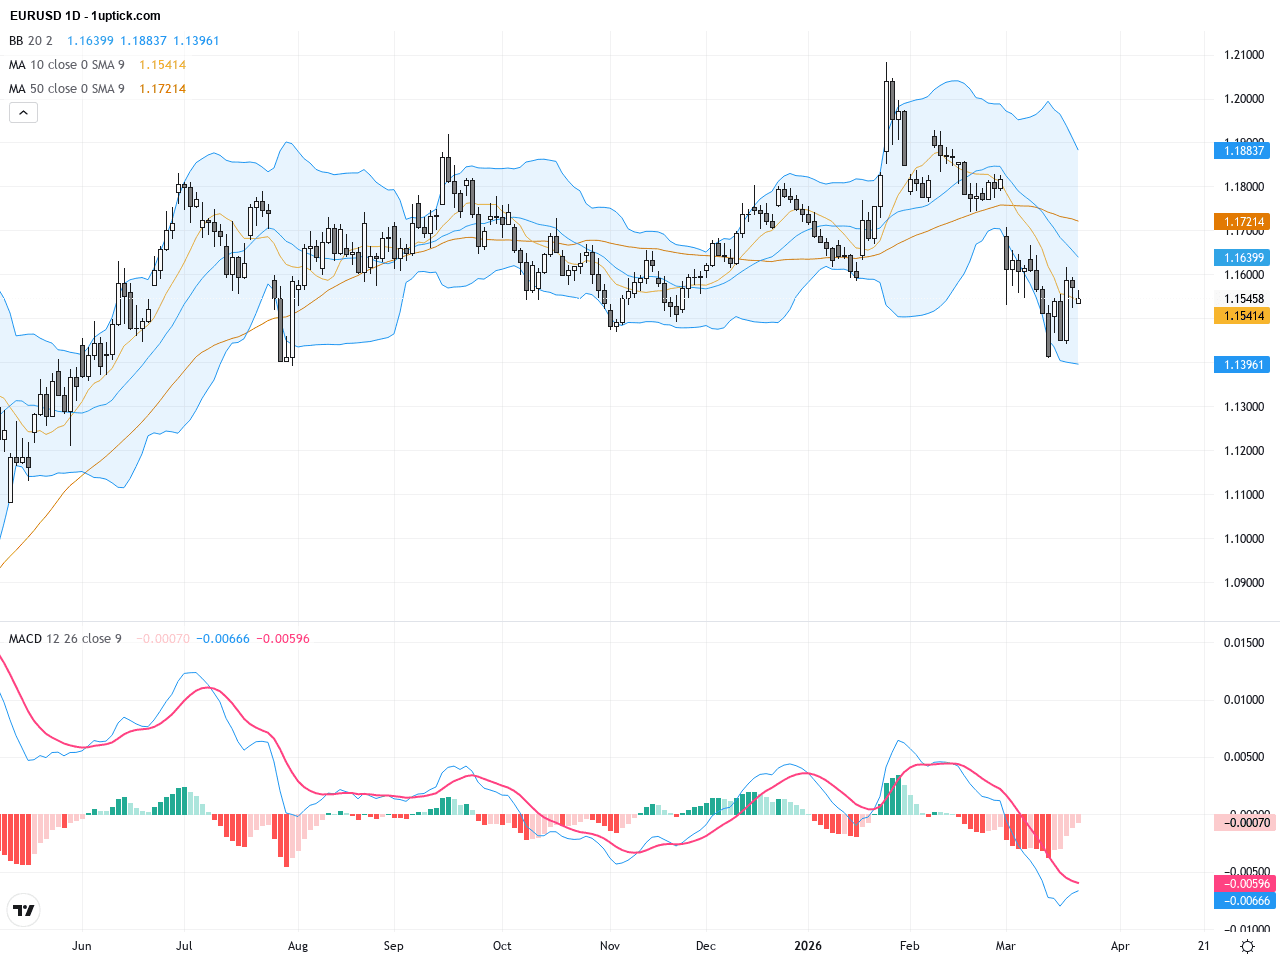
The daily chart shows a clear downtrend in EURUSD, with prices declining steadily over the past week and breaking below the 200-day moving average (~1.16834), signaling a bearish long-term outlook. The Bollinger Bands are contracting and trending downwards, indicating reduced volatility but persistent weakness. The MACD indicator is widening its negative gap with the signal lines below zero, confirming strong bearish momentum. Overall, the daily chart signals heavy selling pressure and a risk of further downside acceleration.
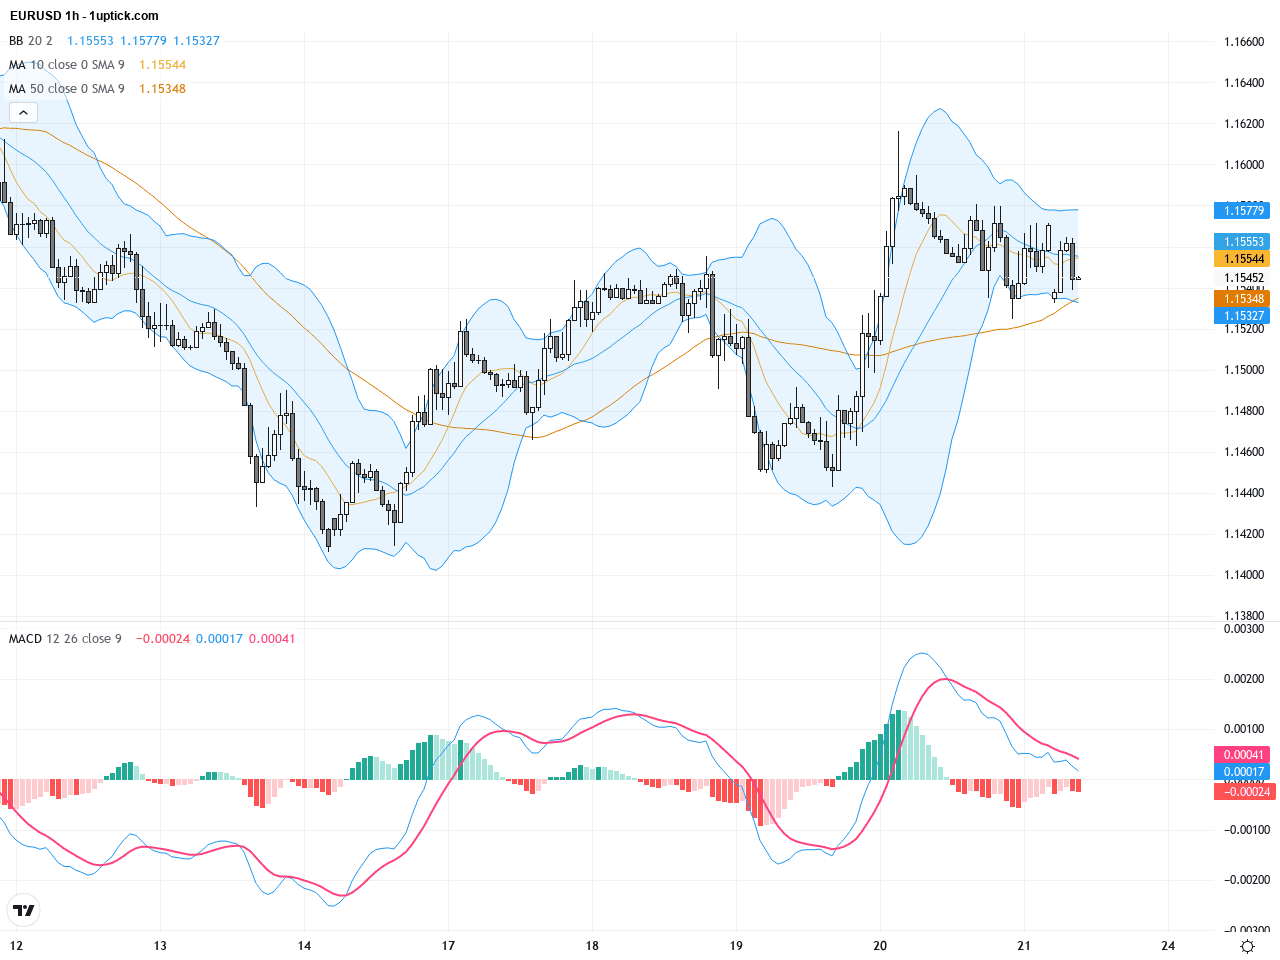
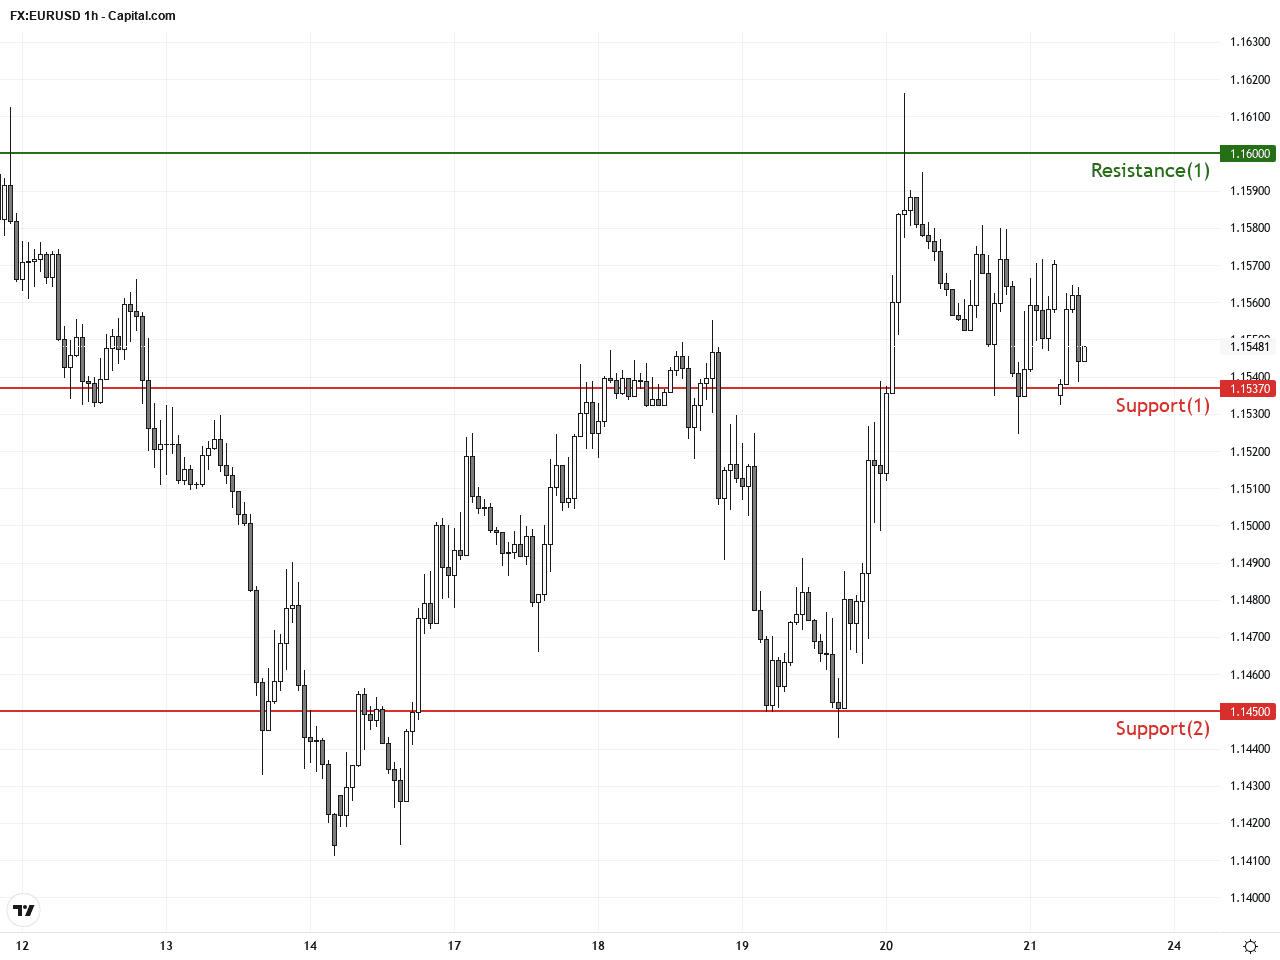
On the hourly chart spanning the last 3-5 days, EURUSD exhibits a decisive downward momentum with a recent death cross formed between short-term moving averages (20 and 50 periods). Prices consistently trade near the lower Bollinger Band, and the MACD displays fresh bearish momentum, suggesting sellers dominate in the short term. Multiple breakdowns of minor supports have failed to trigger sustained rebounds, indicating weak underlying bullish forces. The hourly chart warns of further downside risk in the near term.
Technical Trend: EURUSD is currently in a cautiously bearish trend, displaying weakness across short and medium terms, with a mid-term pattern of tightening volatility and downward consolidation.
A key technical highlight for EURUSD is the imminent death cross forming on the daily chart, where the 50-day moving average approaches crossing below the 200-day moving average, a classic bearish signal. Both MACD and RSI are indicating intensifying bearish momentum. The hourly chart confirms this with moving average death crosses and rising volume on price declines, suggesting a possible acceleration of the downtrend. Critical support and resistance prices identified will help traders time entries, exits, and stop losses effectively.Regarding today’s economic calendar, Poland will release February retail sales data at 09:30 GMT+1, forecasted at a 5.4% year-over-year increase. While this has limited direct impact on EURUSD, overall European economic health remains relevant. The US will issue January construction spending figures at 15:00 GMT+1, expected to show a modest 0.1% month-over-month rise. In general, there are no significant direct economic events today that should strongly affect EURUSD, but these data releases may cause short-term market fluctuations.
Resistance & Support
The above financial market data, quotes, charts, statistics, exchange rates, news, research, analysis, buy or sell ratings, financial education, and other information are for reference only. Before making any trades based on this information, you should consult independent professional advice to verify pricing data or obtain more detailed market information. 1uptick.com should not be regarded as soliciting any subscriber or visitor to execute any trade. You are solely responsible for all of your own trading decisions.