


 |
| Gold V.1.3.1 signal Telegram Channel (English) |

GBPUSD Technical Analysis: Can Cable Break the Key 1.3437 Resistance?
2026-03-13 @ 13:01
Over the past 48 hours, GBP/USD has traded near 1.3331 with several attempts to break the 1.3437 resistance, but the US dollar remains buoyed by safe-haven flows due to ongoing geopolitical tensions and rising inflation concerns, limiting the pound’s upside momentum. Yesterday’s close at 1.33315 marks a slight dip from the previous day, reflecting the market’s cautious stance amid economic and geopolitical uncertainties in the UK and US.
The market focus recently has been on the US Dollar Index (DXY) pushing towards the 99 to 100 level and increased safe-haven demand triggered by Middle East tensions, both of which have strengthened the dollar and pressured the pound. Recent reports from MUFG and Citi highlight that amid worsening Middle East conflict and rising US inflation, the dollar is expected to remain strong in the near term, posing headwinds for GBP/USD’s breakout attempts.
For the average investor, this means GBP/USD continues to face challenges from external political and economic factors. Even with the Bank of England’s measured approach to monetary policy easing, it is unlikely to overcome the dollar’s strength immediately. Unless there is a de-escalation in geopolitical tensions or a decrease in global inflation pressures, short-term volatility and downward pressure on GBP/USD are expected to persist.
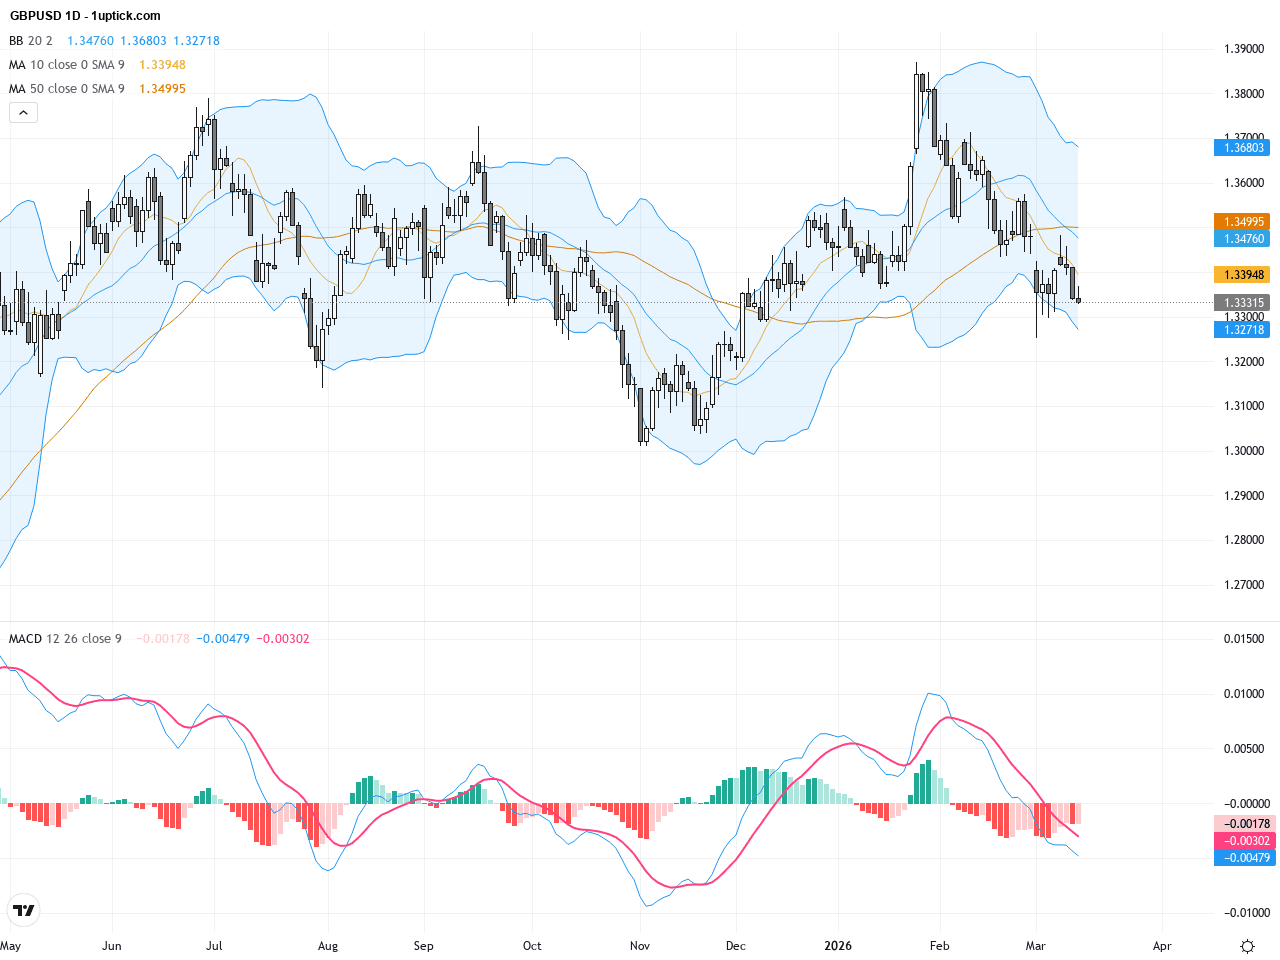
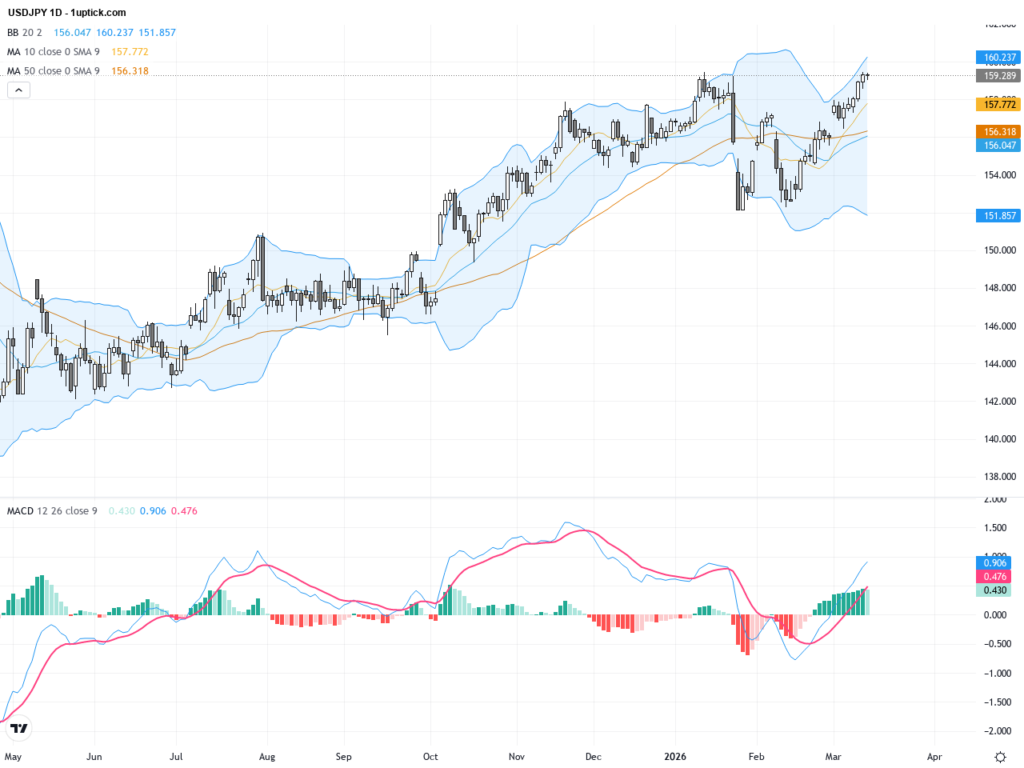
The daily chart shows GBPUSD has retraced from the year’s high of 1.38688 and is hovering between the 50-day moving average (~1.35335) and 200-day moving average (~1.34133), indicating a consolidating phase. Multiple attempts to breach the 1.3437 resistance proved short-lived. Bollinger Bands point to price near the middle band with subdued volatility. MACD hovers near the zero line, signaling a lack of clear momentum. Overall, the daily trend leans toward a consolidation with a potential upward bias pending breakout confirmation.
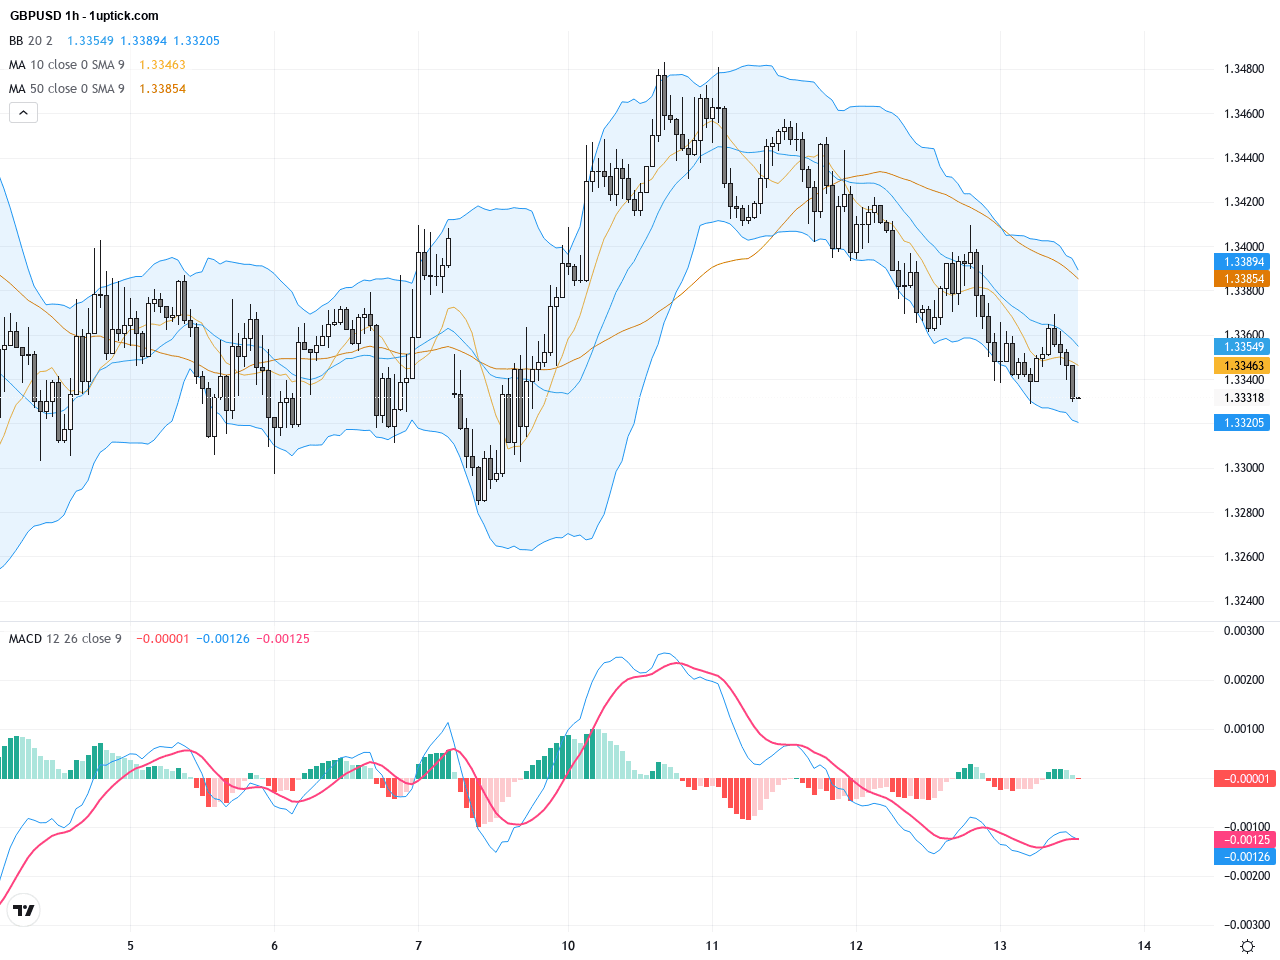
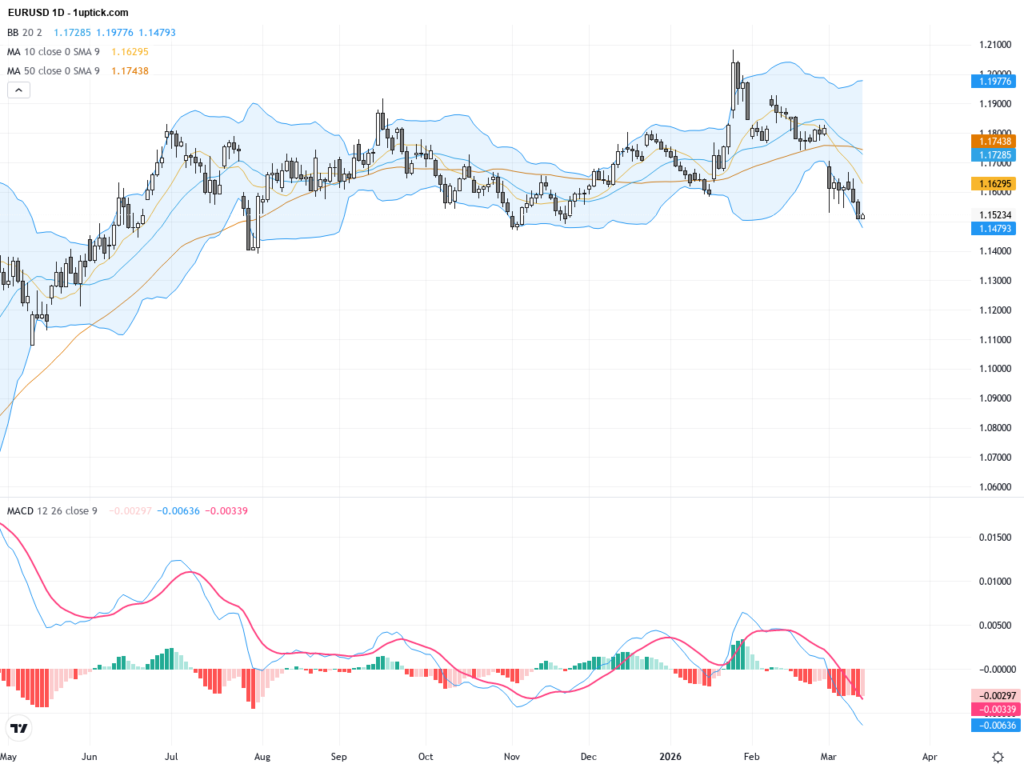
The hourly chart over the past five days shows a short-term uptrend with price oscillating between 1.3467 and 1.3560. Short-term moving averages are converging, accompanied by a slightly waning MACD bullish momentum. Bollinger Bands have narrowed, suggesting potential short-term consolidation. The 1.3500 level has provided recent support forming a short-term base. A break above 1.3560 could trigger rapid gains, whereas a fall beneath 1.3460 might signal further pullback.
Technical Trend: Consolidation: GBPUSD remains range-bound between 1.33 and 1.35 with no clear directional bias; awaiting breakout or key economic data for trend clarity.
From a technical perspective, GBPUSD on the daily chart is forming a wedge-like consolidation pattern after retracing from 1.3850. The critical resistance at 1.3437 acts as a short-term battleground. Hourly candlestick patterns such as dojis and spinning tops illustrate current market indecision and waning momentum. A modest MACD divergence is cautionary for an impending pullback or sideways move. Traders should watch for a breakout above 1.35 or breakdown under key support to confirm trend direction alongside economic data releases.Today at 08:00 GMT+1, the UK releases key economic indicators including January trade balance, GDP (month-over-month and quarter-over-quarter), industrial production, and manufacturing output—expected to show modest improvement. US personal consumption expenditure (PCE) data at 13:30 GMT+1 will also influence USD strength. If UK data meets or exceeds forecasts while US data disappoints, it could lend bullish support to GBPUSD. Conversely, weaker UK figures or strong US data would likely weigh on the pair. Overall, today’s economic calendar is important for near-term GBPUSD price action.
Resistance & Support

The above financial market data, quotes, charts, statistics, exchange rates, news, research, analysis, buy or sell ratings, financial education, and other information are for reference only. Before making any trades based on this information, you should consult independent professional advice to verify pricing data or obtain more detailed market information. 1uptick.com should not be regarded as soliciting any subscriber or visitor to execute any trade. You are solely responsible for all of your own trading decisions.