 |
| Gold V.1.3.1 signal Telegram Channel (English) |

USDCAD: Key Technical Breakout Resistance at 1.3730 Signals Cautiously Bullish Trading Outlook
2026-03-24 @ 13:03
Over the past 24 to 48 hours, the USD/CAD pair experienced notable volatility, closing yesterday at 1.37553, slightly higher than the previous day’s 1.37247. Market sentiment was highly influenced by the US postponement of military strikes on Iran, leading to a shift in risk appetite that softened the US dollar against the Canadian dollar initially.
This delay in military action directly triggered fluctuations in the dollar, with the market shifting from a risk-off to a more risk-on mood. The USD/CAD price dipped early but recovered, reflecting investor relief at the avoided escalation of conflict. Tweets from Trump further stirred market nerves, resulting in choppy trading as traders awaited a decisive break above the key resistance level at 1.3730 to confirm any sustained trend.
For the average investor, these dynamics imply heightened short-term market uncertainty, urging caution amid sudden geopolitical developments. The Canadian dollar’s movement is now driven by a complex mix of factors—no longer solely linked to oil prices but also influenced by risk sentiment and interest rate outlooks. Overall, USD/CAD’s price action highlights a delicate balance between safe-haven demand and risk-on flows, suggesting ongoing volatility as political decisions and global tensions evolve.
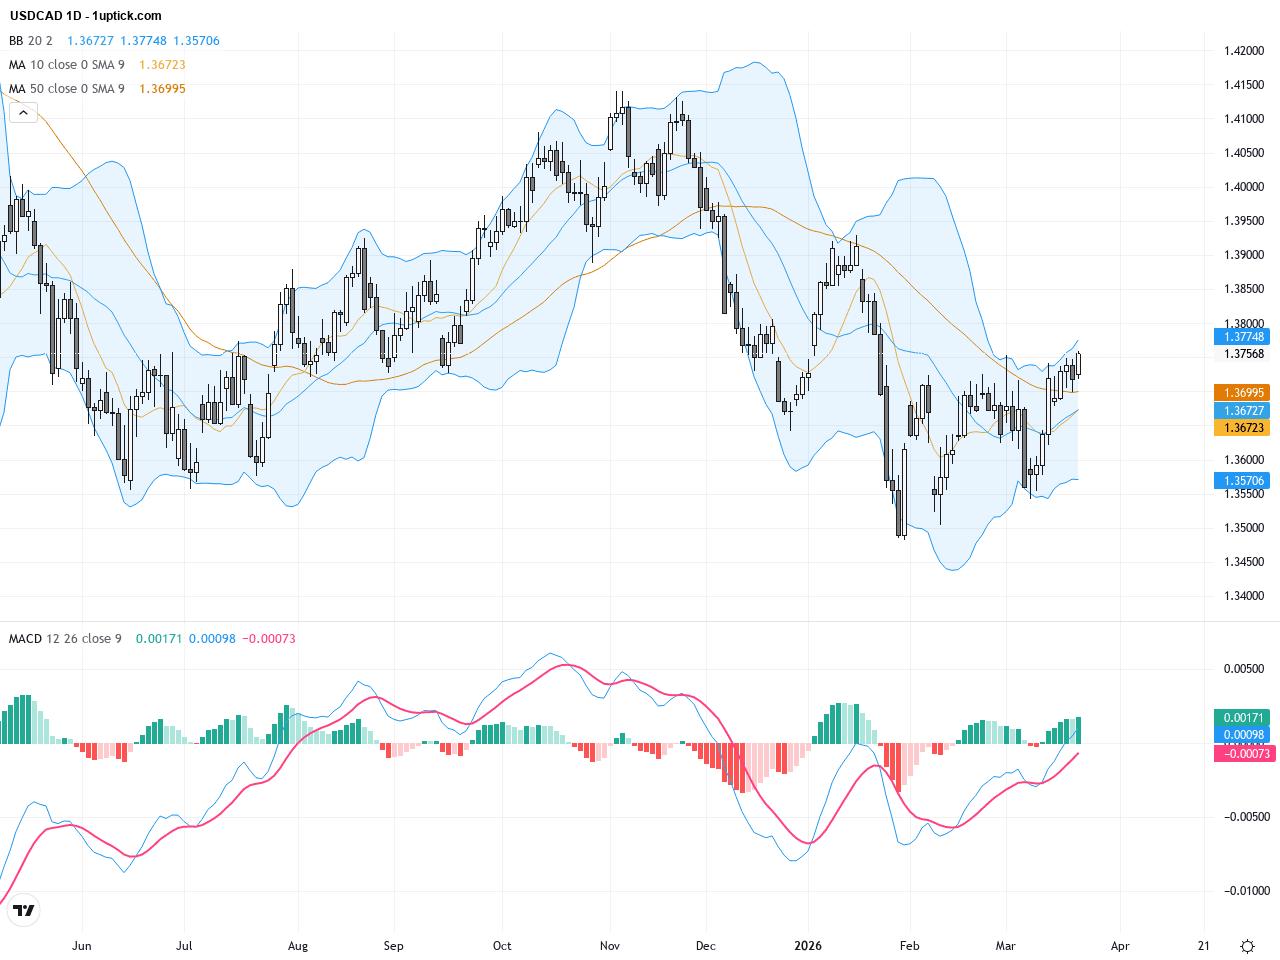
The daily chart reveals USDCAD moving in a range-bound pattern since the start of the year, with recent price action pushing towards the critical 1.3730 resistance zone. The 50-day moving average at 1.36486 supports a mild uptrend, while the 200-day at 1.38248 acts as overhead resistance. Bollinger Bands show widening volatility, and the MACD remains in positive territory, all suggesting a cautiously bullish technical stance pending a confirmed breakout.
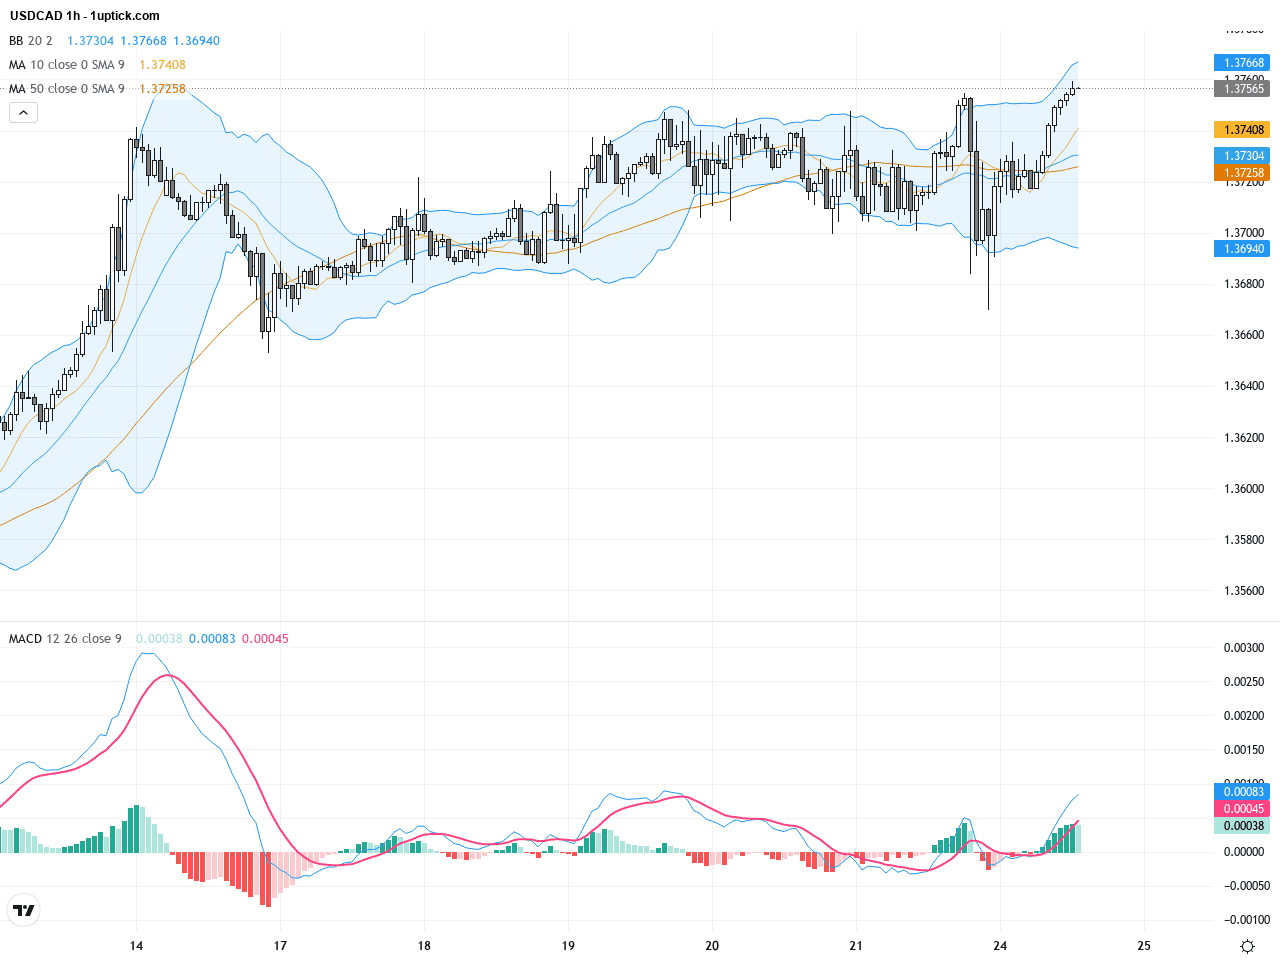
The hourly chart over the last 3-5 days shows USDCAD experiencing a dip followed by a sharp rebound. Multiple MACD crosses indicate fluctuating momentum. Price action tests the middle Bollinger Band repeatedly, establishing a short-term consolidation. Recent bullish engulfing candlestick signals suggest an imminent upward move over the next 24 hours, making it worth watching for breakout confirmation.
Technical Trend: Cautiously bullish trend with high volatility consolidation and readiness for a potential breakout.
USDCAD is testing a critical resistance at 1.3730. Daily MACD remains positive and Bollinger Bands expansion indicates rising volatility. The hourly bullish engulfing candlestick combined with improved risk sentiment hints at short-term upside potential. Caution remains warranted with possible intraday pullbacks. A daily close above 1.3730 is crucial to confirm a sustained breakout and stronger bullish momentum.Today’s economic calendar features no significant or direct events that would immediately impact USDCAD. Key releases include Japan’s CPI and PMI data and US labor productivity metrics. Since USD/CAD is currently driven more by geopolitical risks and risk sentiment rather than economic fundamentals, traders should focus on broader market sentiment and oil price movements for clues.
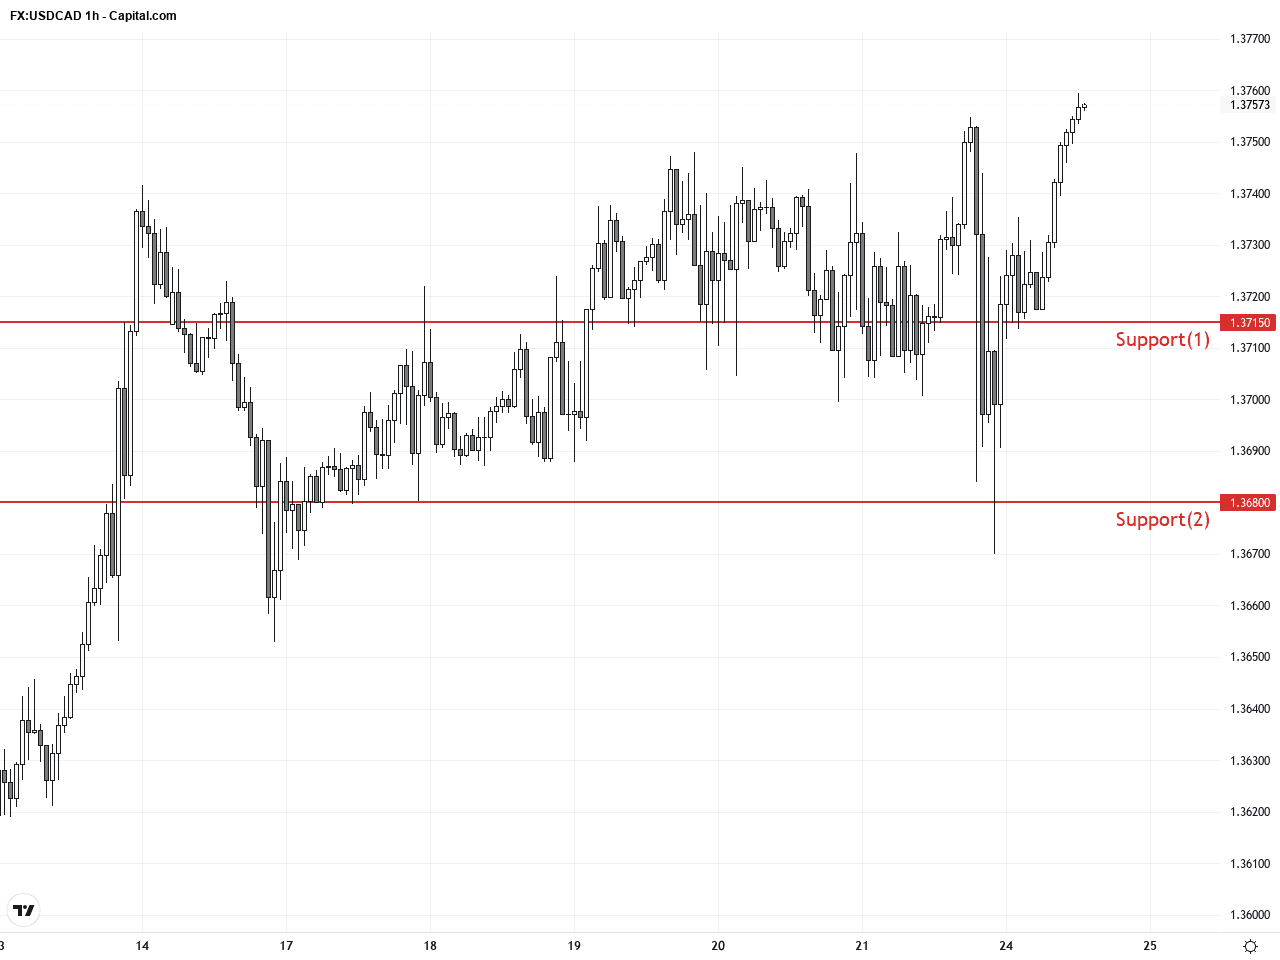
Resistance & Support
The above financial market data, quotes, charts, statistics, exchange rates, news, research, analysis, buy or sell ratings, financial education, and other information are for reference only. Before making any trades based on this information, you should consult independent professional advice to verify pricing data or obtain more detailed market information. 1uptick.com should not be regarded as soliciting any subscriber or visitor to execute any trade. You are solely responsible for all of your own trading decisions.