


 |
| Gold V.1.3.1 signal Telegram Channel (English) |

XAUUSD Breaks Key Support at 4400: In-Depth Gold Technical and Fundamental Analysis
2026-03-24 @ 05:04
In the past 24 to 48 hours, XAUUSD (Gold priced in US dollars) experienced significant volatility, especially on March 23, when the price sharply declined from highs and then stabilized near $4,407. The closing price yesterday was $4,411.68, reflecting the market’s strong reaction amid heightened uncertainty.
The market turbulence was mainly driven by the interplay of sharp oil price swings and geopolitical risks. Notably, comments from former US President Trump regarding Iran spurred a stock market rally and a drop in oil prices. As oil pulled back towards around $88 per barrel, investor demand for safe-haven gold fluctuated, causing its price to initially plunge and then stabilize. Additionally, some traders capitalized on the so-called ‘Trump’s TACO Trade’ strategy repeatedly this year, adding complexity to market sentiment.
For the average investor, this round of gold price swings is like navigating a stormy sea. The oil price fluctuations and political risks are uncontrollable forces causing gold prices to ebb and flow. It’s important to understand that during periods of global energy uncertainty and geopolitical tension, price swings in gold, a traditional safe haven, are normal in the short term, while its long-term value remains supported by fundamentals.
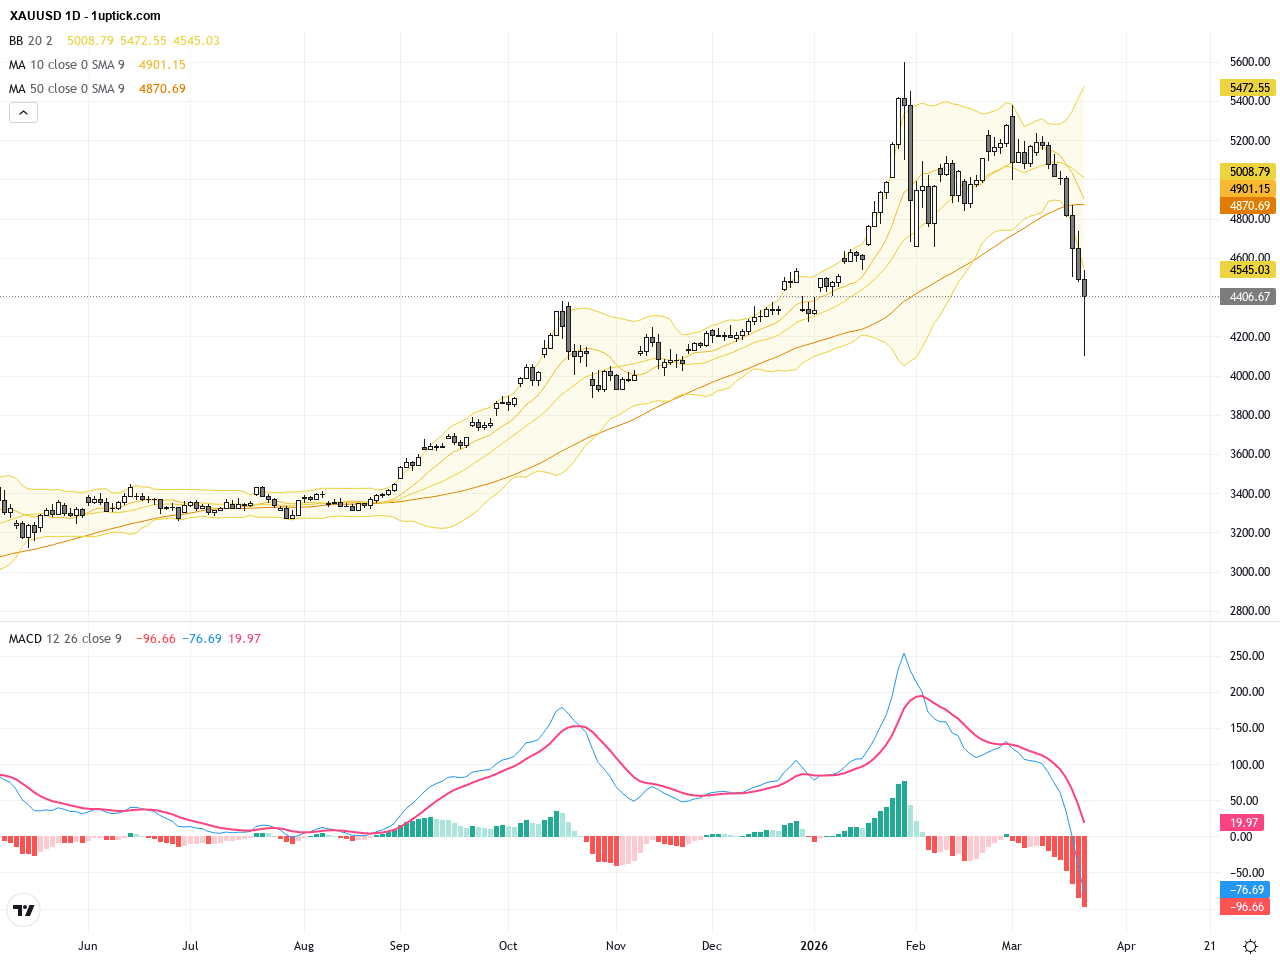
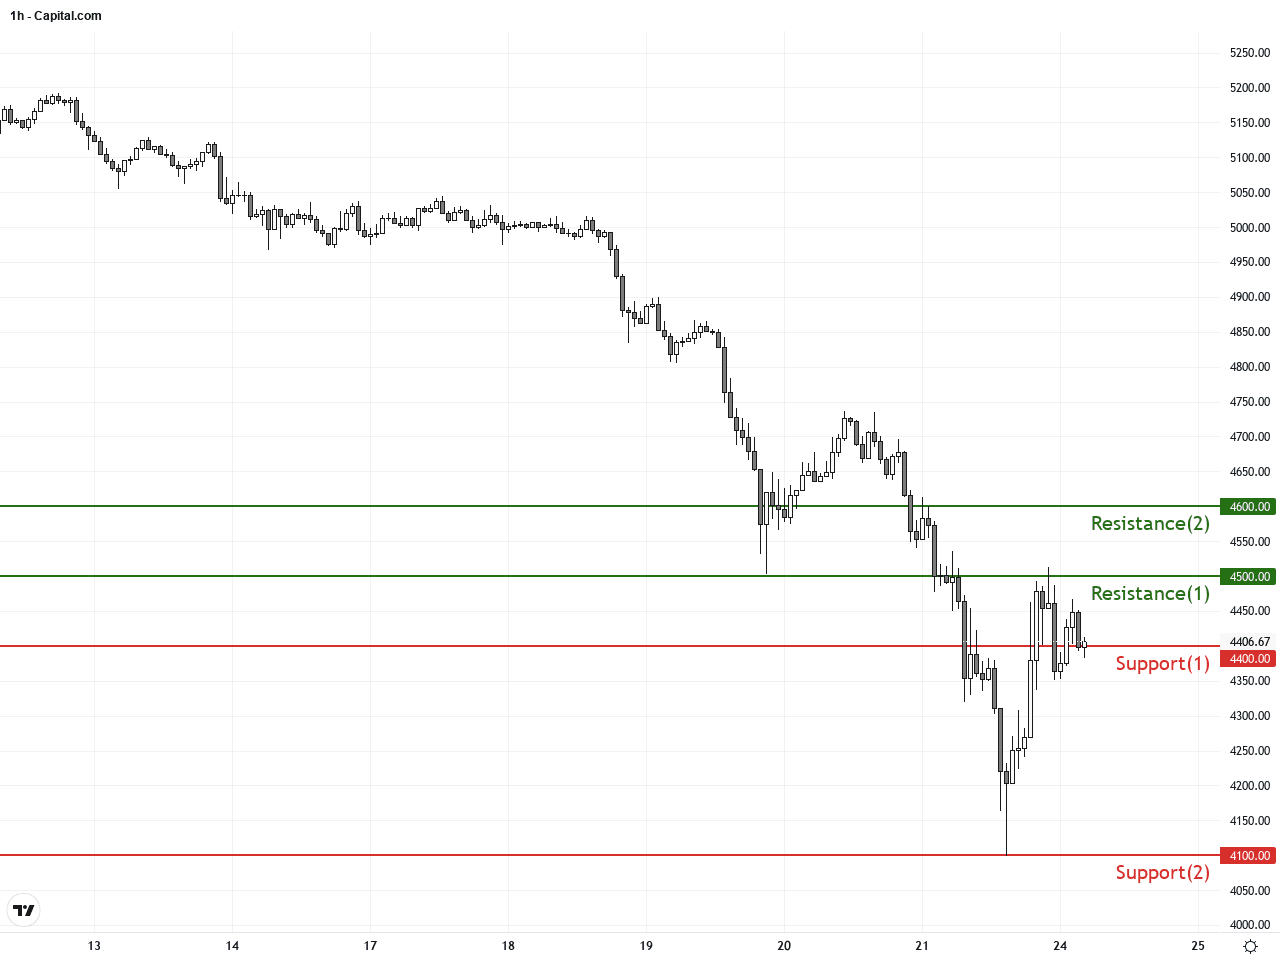
The daily chart shows a sharp downtrend from mid-March highs above 5000 USD to a low near 4099 USD on March 23 before rebounding to 4411 USD. Moving averages (20 and 50-day) slope downwards signaling bearish momentum. The Bollinger Bands have widened, reflecting increased volatility, while the MACD remains negative but showing signs of a potential bottoming. Overall, the longer-term trend remains bearish, with 4400 USD acting as a crucial support level to watch.
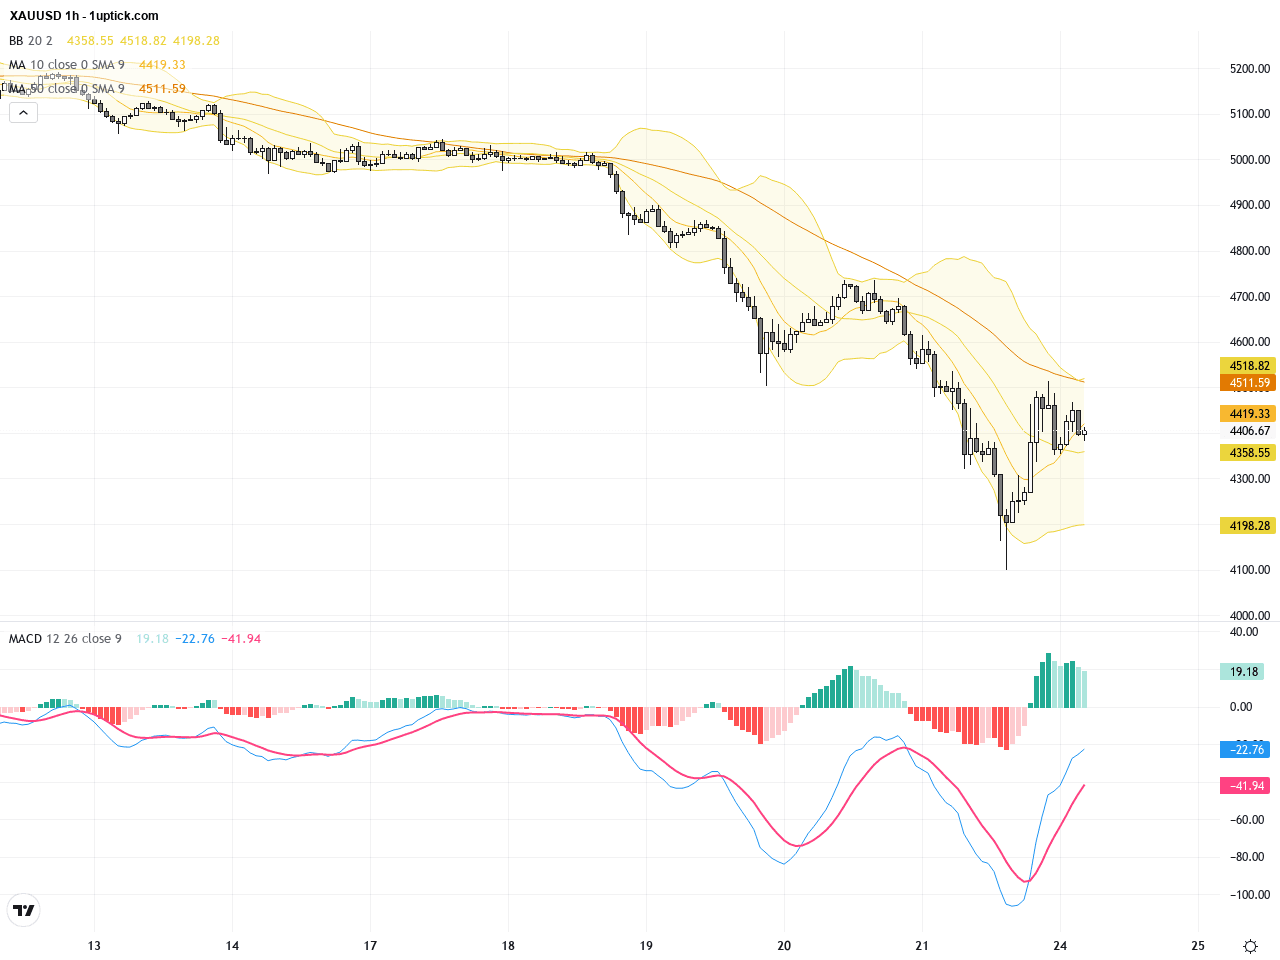
The hourly chart over the past 3-5 days reveals a double bottom pattern near 4099 USD, followed by a sharp recovery. Short-term EMAs (5 and 10-hour) are bullishly aligned, with price oscillating near the Bollinger Band middle line. MACD shows a bullish crossover near zero, indicating building momentum. Significant bullish engulfing candlesticks suggest potential continuation of the short-term rebound, though resistance around 4500 USD is a hurdle to clear.
Technical Trend: Current trend is best described as a ‘cautiously consolidating’ environment with predominant bearish bias but short-term rebound potential. Price action is range-bound near critical support and resistance levels awaiting directional confirmation.
From a technical standpoint, there is a conflict between the dominant bearish trend on the daily chart and the short-term bullish correction on the hourly chart. Rising volume supports a high-market debate environment. Daily MACD remains in negative territory, confirming the overall weak trend, but hourly MACD bullish crossover signals short-term buying opportunities. The recent bullish engulfing near support at 4099 USD is a positive sign. Holding above 4420 USD in the next 24 hours could bolster the rebound, while a break below 4099 USD risks renewed bearish momentum. Caution is advised.Today’s economic calendar highlights Polish retail sales and money supply data, as well as US construction spending figures. Although none are expected to directly impact XAUUSD, weaker US construction spending could indirectly weigh on the USD, benefiting gold prices. Overall, no significant direct economic events today will decisively move gold prices but traders should remain attentive to broader USD moves and geopolitical developments for guidance.
Resistance & Support
The above financial market data, quotes, charts, statistics, exchange rates, news, research, analysis, buy or sell ratings, financial education, and other information are for reference only. Before making any trades based on this information, you should consult independent professional advice to verify pricing data or obtain more detailed market information. 1uptick.com should not be regarded as soliciting any subscriber or visitor to execute any trade. You are solely responsible for all of your own trading decisions.