


 |
| Gold V.1.3.1 signal Telegram Channel (English) |

USDCAD: Oil Volatility and Dollar Strength Set the Stage for Key Support and Resistance Levels
2026-03-12 @ 13:01
Over the past 24 to 48 hours, the USD/CAD exchange rate exhibited notable volatility, opening at 1.3592, reaching a high of 1.36044 and a low of 1.35783, before settling slightly back at 1.3592. During this time, the Canadian dollar’s movement was closely tied to oil prices, with fluctuations in crude directly influencing market risk sentiment and acting as key drivers behind the USD/CAD price changes.
According to recent market news, the US dollar has broadly strengthened as American investors came back into the market. However, shifts in risk appetite amid geopolitical tensions in the Middle East have caused oil prices to fluctuate sharply, which in turn impacted USD/CAD. Notably, oil prices surged past $100 per barrel following further production cuts by major oil producers, boosting the Canadian dollar. Despite this, the US dollar’s safe-haven appeal helped offset some of the pressure, resulting in a choppy rather than clear directional move for USD/CAD.
For the average investor, this means short-term currency volatility is largely influenced by the interplay between global energy markets and geopolitical risk. If you are tracking the US dollar’s performance globally, movements in USD/CAD provide a real-time reflection of the US economic fundamentals intertwined with worldwide energy dynamics. In the coming days, with US inflation data on the horizon and fluctuating risk sentiment, USD/CAD is likely to remain volatile—making it essential for investors to stay alert to how market news directly impacts the currency pair.
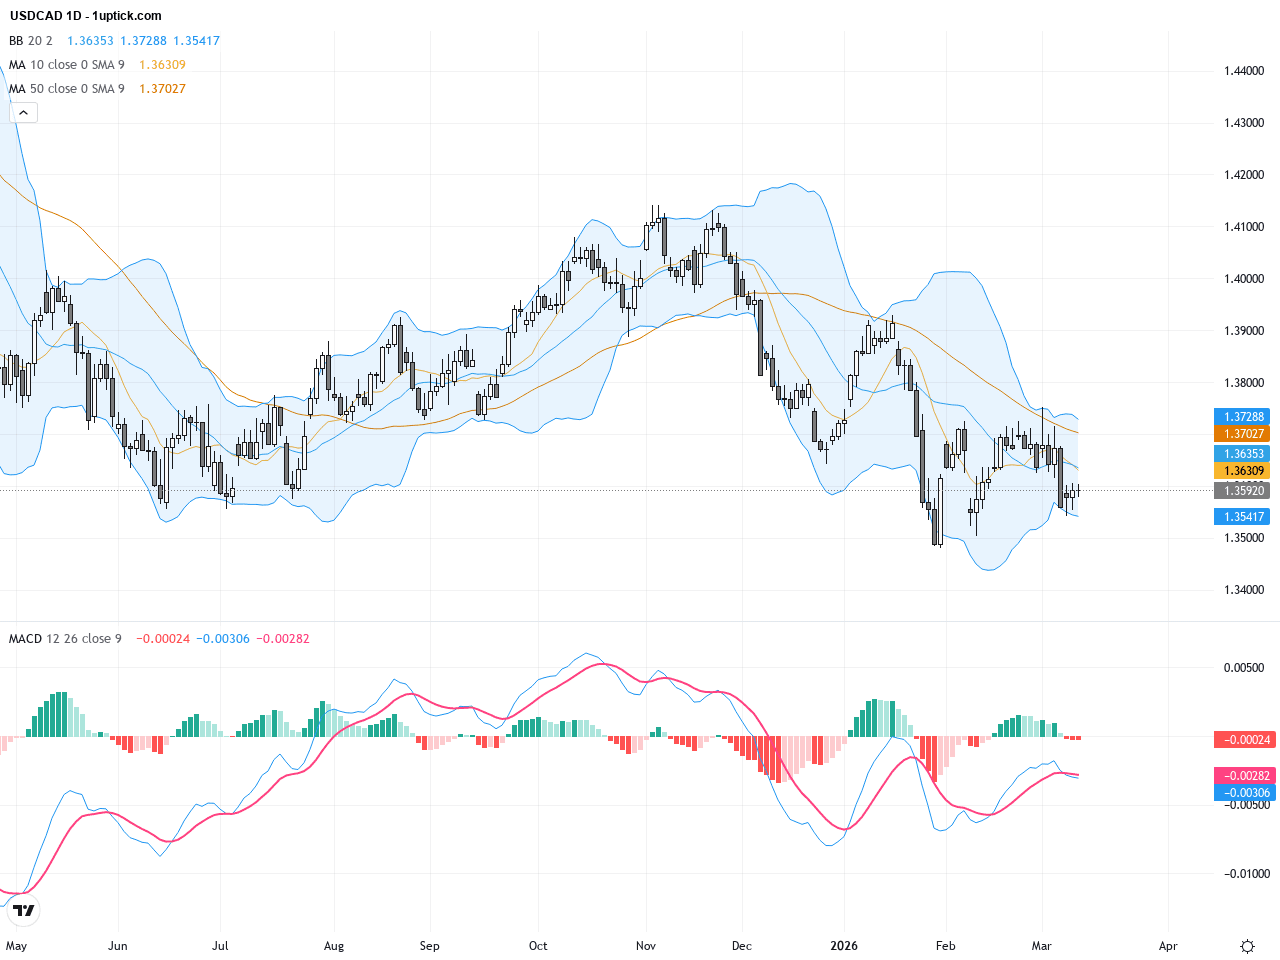
On the daily chart, USDCAD shows a short-term downtrend as prices gradually declined from recent highs around 1.3650 to hover within the 1.3550-1.3600 range. The 50-day moving average is sloping downward with prices below it, while the 200-day MA remains above, confirming a longer-term bearish bias. The Bollinger Bands are tightening, indicating reduced volatility ahead of a potential breakout. MACD remains below zero, suggesting weak momentum and the possibility of further downside.
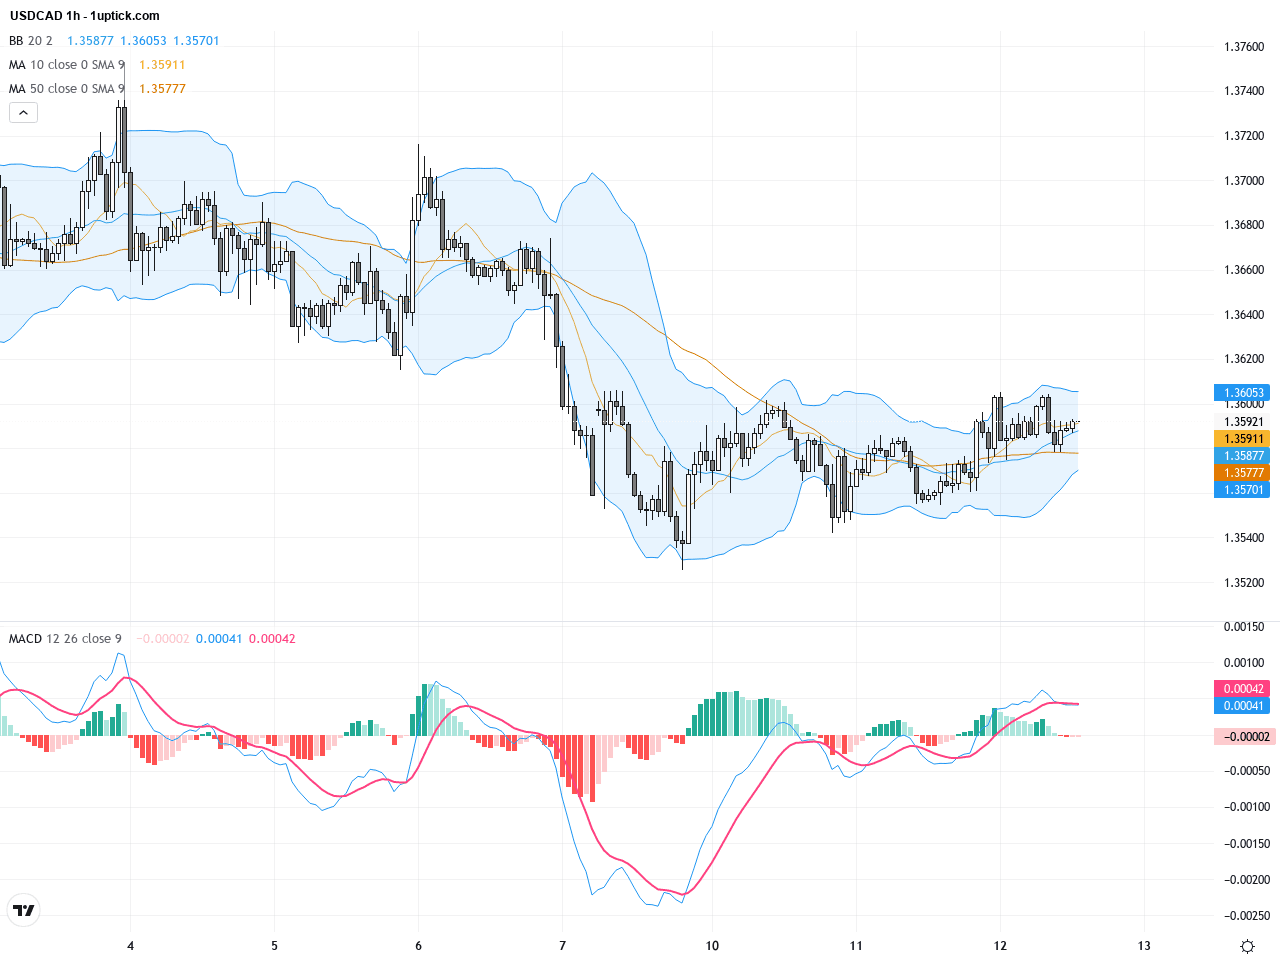
Examining the past 3-5 days on the hourly chart, USDCAD is consolidating with a slight downward bias, oscillating between 1.3570 and 1.3600. Short-term moving averages (20 and 50) are intertwined, showing no clear directional momentum yet. Bollinger Bands have expanded recently, accompanied by a mild MACD bullish crossover, hinting at a possible short-term rebound. Watch how support around 1.3570 holds and if breaking above 1.3600 can trigger a larger bounce.
Technical Trend: The current trend for USDCAD is cautiously bearish; short-term rebounds are possible, but the broader trend remains downward with increased volatility and a heightened risk of technical breakdown.
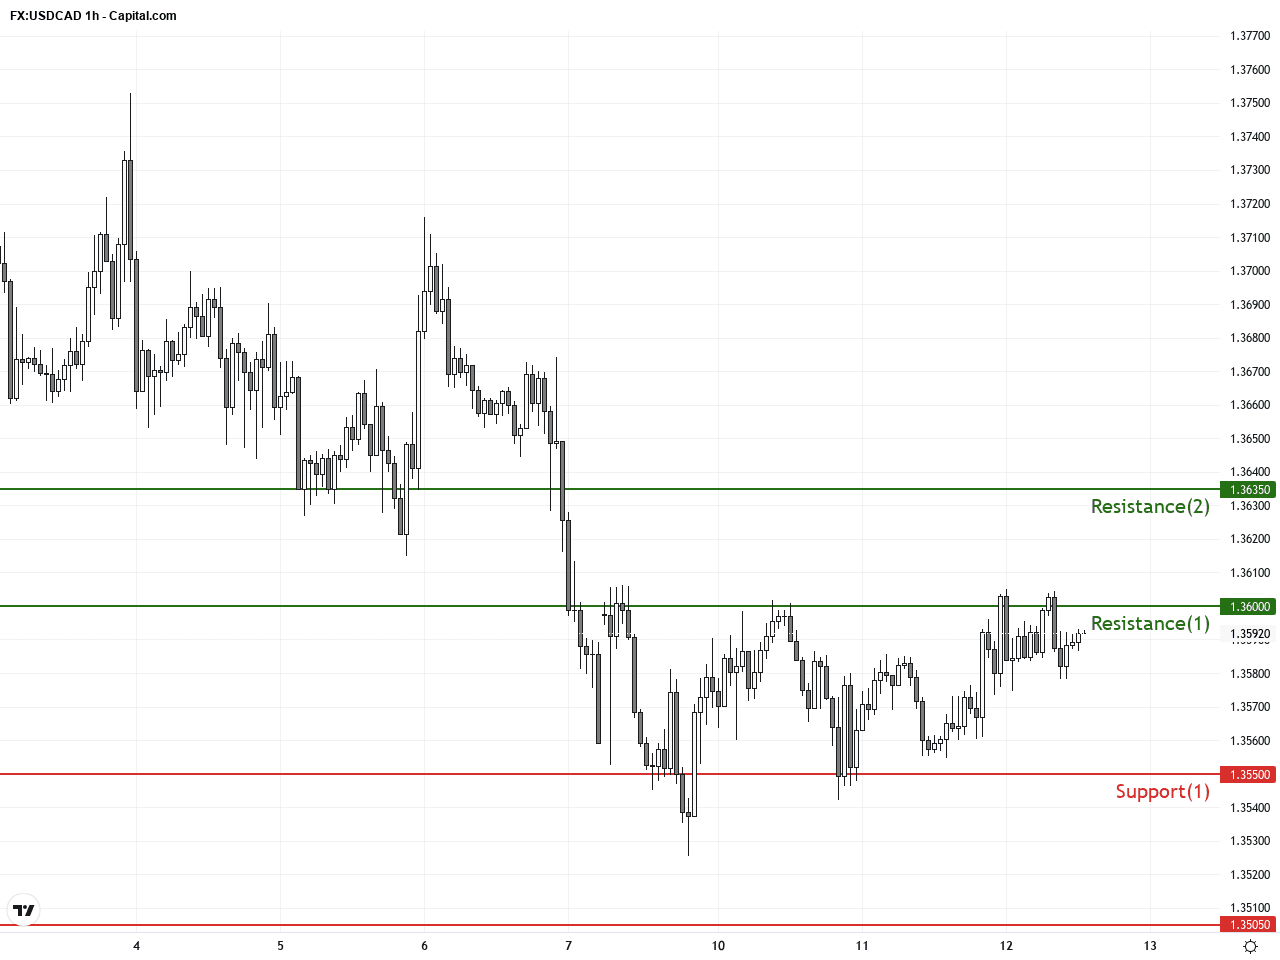
Technically, USDCAD is firmly in a short-term downtrend on the daily chart, though the hourly chart shows a potential bullish momentum shift indicated by a MACD crossover. A tightly formed consolidation pattern around 1.3550-1.3600 suggests an imminent breakout. A confirmed move above 1.3600 would signal a short-term bullish reversal, while a break below 1.3550 affirms ongoing bearish pressure. The recent engulfing candlestick pattern signals indecision and a possible turning point. Traders should monitor volume and momentum changes closely for next moves.Today’s economic calendar lists several key Canadian and US releases at 13:30 GMT+1, including Canadian Building Permits, Wholesale Trade and Trade Balance, as well as US Weekly Jobless Claims, Building Permits, and Trade Balance. Stronger-than-expected figures could increase volatility in USD and CAD pairs, directly impacting USDCAD’s price action. Market participants should be alert to these data points for potential trading signals.
Resistance & Support
The above financial market data, quotes, charts, statistics, exchange rates, news, research, analysis, buy or sell ratings, financial education, and other information are for reference only. Before making any trades based on this information, you should consult independent professional advice to verify pricing data or obtain more detailed market information. 1uptick.com should not be regarded as soliciting any subscriber or visitor to execute any trade. You are solely responsible for all of your own trading decisions.