


 |
| Gold V.1.3.1 signal Telegram Channel (English) |

USDCAD Technical & Fundamental Report: Geopolitical Risks Drive Pair Near 1.3930 Resistance
2026-03-31 @ 13:01
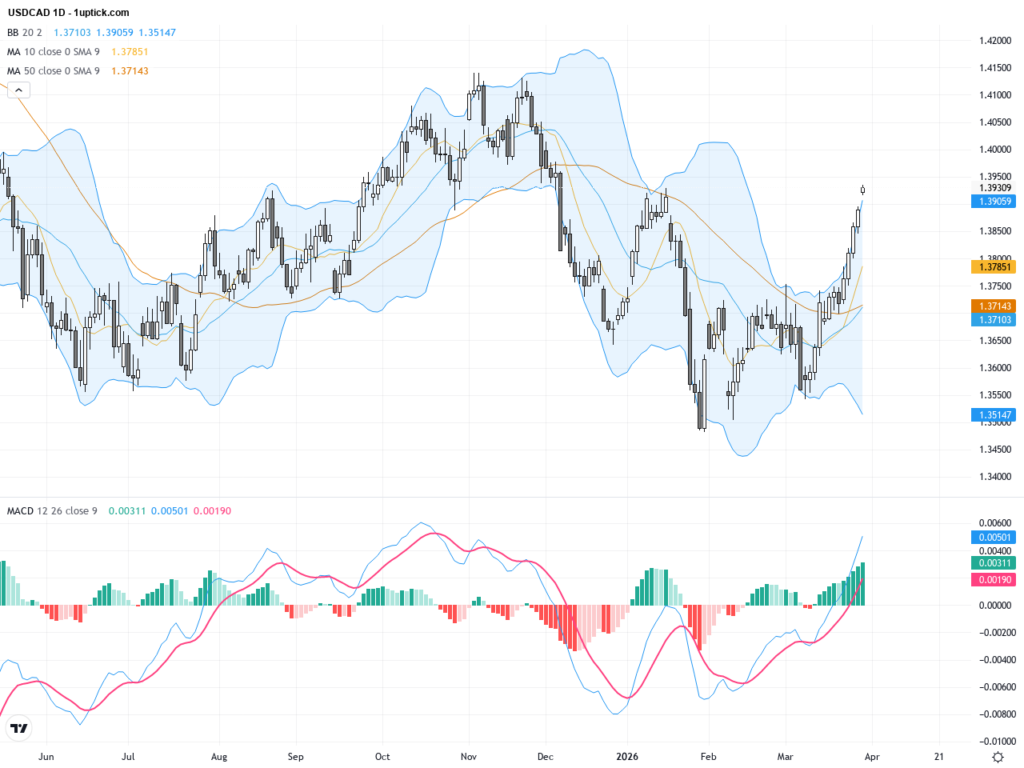
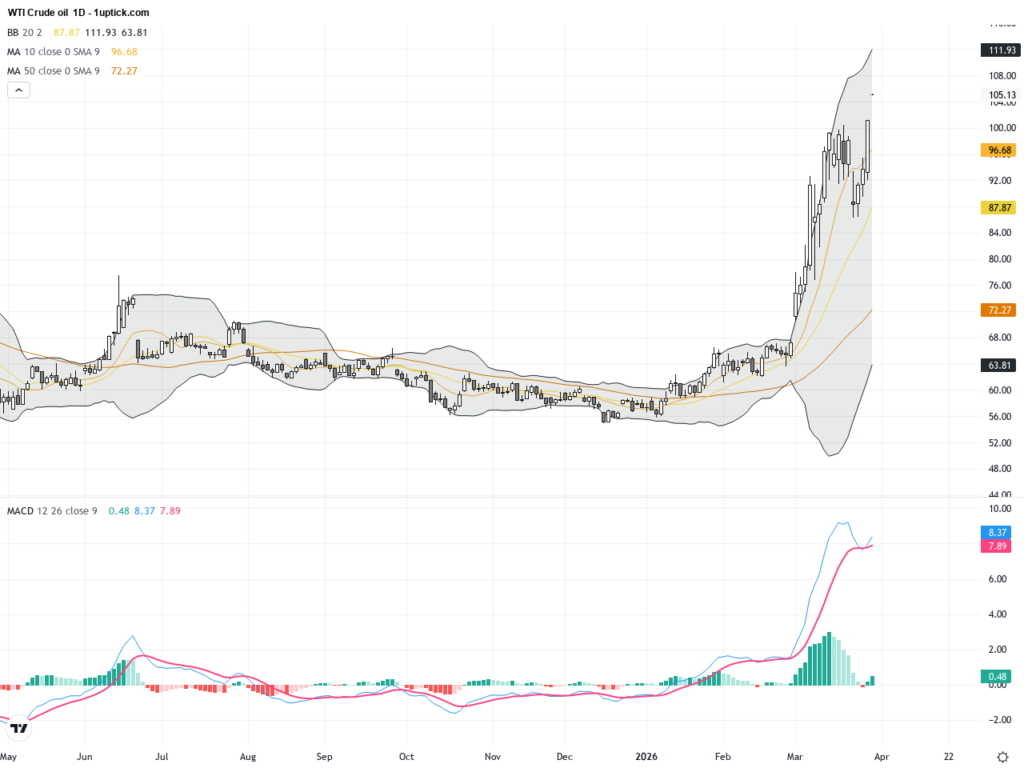
Over the past 24 to 48 hours, the US Dollar against the Canadian Dollar (USDCAD) has maintained its upward momentum, closing yesterday at 1.39308. The recent surge is driven largely by escalating geopolitical tensions in the Middle East, particularly the US-Iran conflict uncertainty, which increased demand for safe-haven currencies like the US dollar. Reports of President Trump threatening to obliterate Iran’s energy facilities have caused significant oil price volatility, intensifying risk-off sentiment and boosting the USD.
This environment has put pressure on the Canadian dollar due to Canada’s exposure as an energy exporter. Although the US postponed military strikes on Iran, temporarily easing immediate war fears, the market remains cautious about future developments. This continuing uncertainty supports the dollar’s strength versus the Loonie.
For the average investor, this scenario highlights how geopolitical events can cause sharp short-term currency moves and underscores the risks for those holding CAD assets. With the US dollar likely to stay supported amid ongoing unrest, investors should monitor developments closely as the Canadian dollar may remain under pressure in the near term.

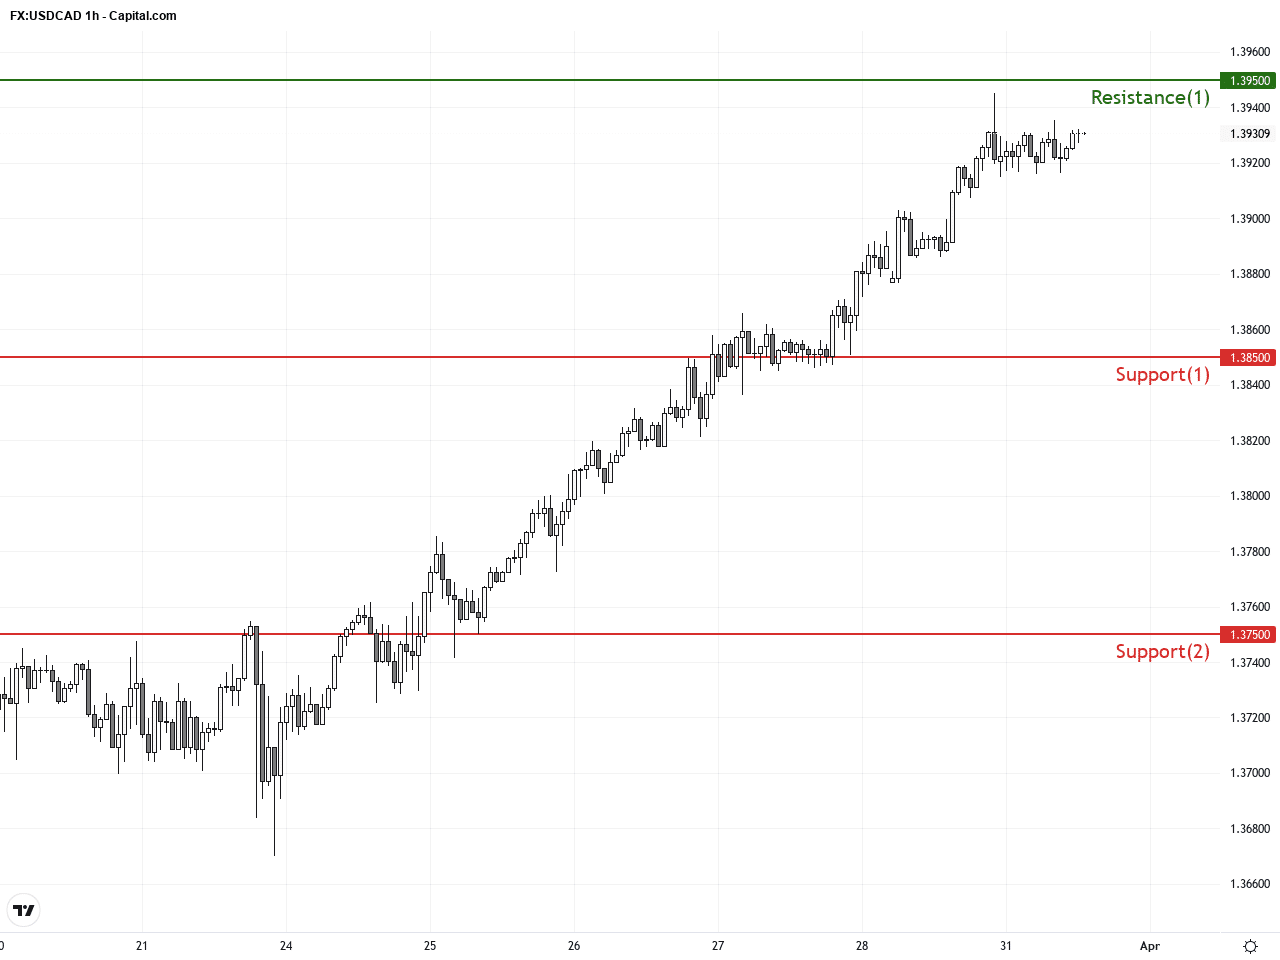
The daily chart shows a clear uptrend since early March with the price breaking above both the 50-day (around 1.36731) and 200-day moving averages (about 1.38269), indicating a solid bullish trend mid-term. Recently, price faces resistance near 1.3930. The Bollinger Bands expansion alongside a robust positive MACD momentum suggests bulls remain in control, though conditions may be entering overbought territory, signalling caution.
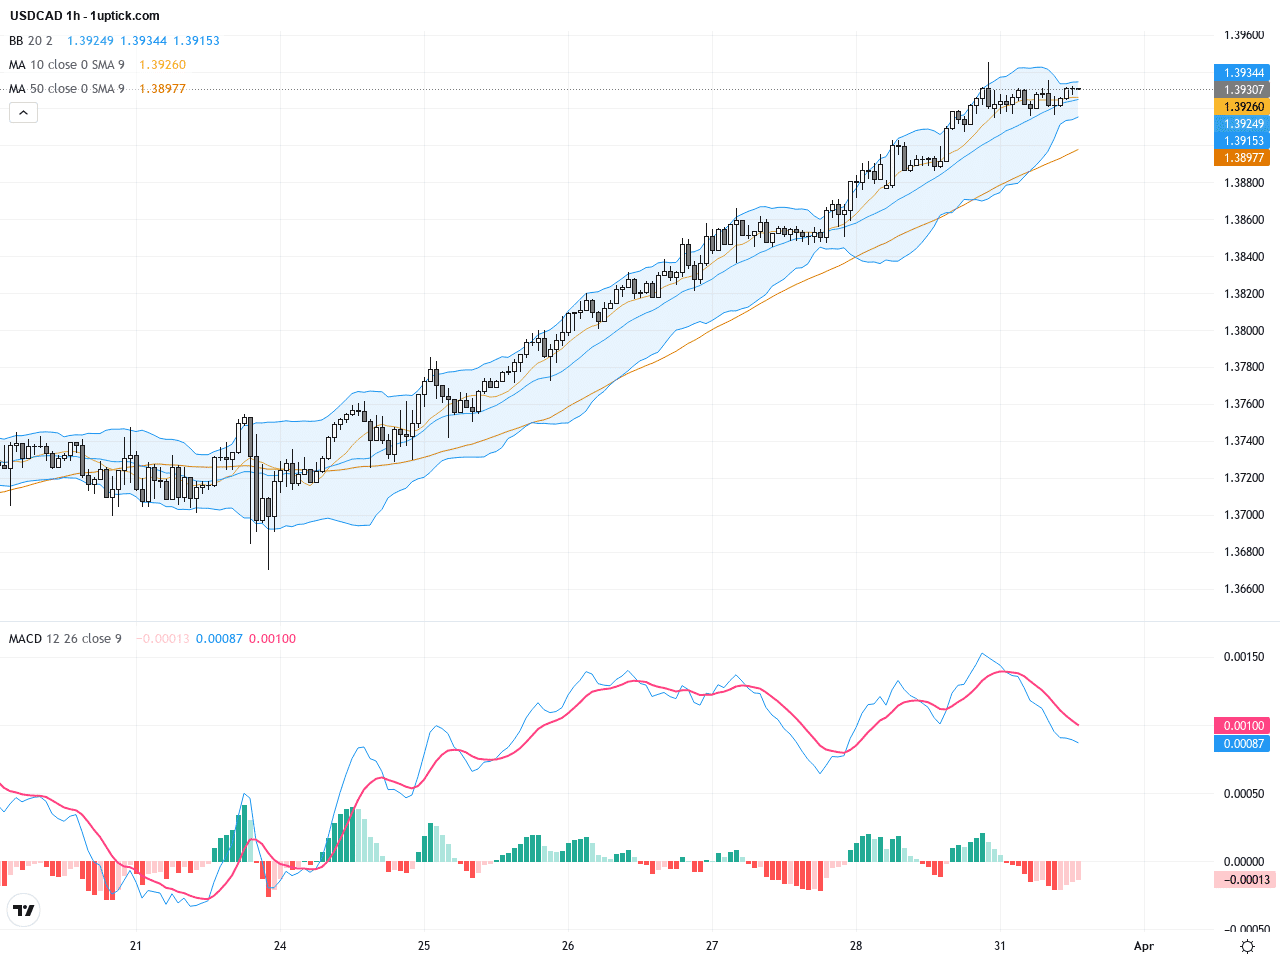
The hourly chart over the past 3-5 days reveals a price consolidation between 1.3900 and 1.3950. The 50-hour moving average uptrend and a mild MACD golden cross signal likely continuation of the short-term bullish trend. Price repeatedly tests the upper Bollinger Band, suggesting building pressure; a breakout above could confirm a new short-term up leg.
Technical Trend: The current trend for USDCAD is cautiously bullish, with clear upward momentum but possible pullback risk, recommending vigilance around key resistance and news.
Technically, the MACD remains in positive territory and RSI nears 70, indicating bullish momentum but potential overbought conditions. A bullish flag pattern forming on the daily chart suggests continuation is likely. The hourly chart’s golden cross on MACD and testing of the upper Bollinger Band provide near-term entry signals, yet geopolitical uncertainty remains a key risk.Today’s economic calendar primarily features Japanese and Canadian data, with Tokyo Core CPI slightly below forecasts, implying softer inflation in Japan with limited direct impact on USDCAD. Canadian monthly GDP is expected at 0.0% month-on-month, with little deviation from prior figures, signaling minimal short-term price impact. Overall, no significant direct economic events today are anticipated to influence USDCAD, so focus remains on geopolitical risk developments.
Resistance & Support
The above financial market data, quotes, charts, statistics, exchange rates, news, research, analysis, buy or sell ratings, financial education, and other information are for reference only. Before making any trades based on this information, you should consult independent professional advice to verify pricing data or obtain more detailed market information. 1uptick.com should not be regarded as soliciting any subscriber or visitor to execute any trade. You are solely responsible for all of your own trading decisions.