


 |
| Gold V.1.3.1 signal Telegram Channel (English) |

USDJPY: Bullish Momentum Nears Key Resistance at 159 Amid Technical Strength and Market News
2026-03-13 @ 11:02
Over the past 24 to 48 hours, the USD/JPY pair held steady near 159.28, closely matching yesterday’s closing price of 159.285. The recent strengthening of the US dollar has largely been driven by liquidity demand triggered by weak stock markets, with the US Dollar Index (DXY) climbing to a 3.5-month high, putting upward pressure on the dollar against the yen. Rising US Treasury yields have also bolstered the dollar’s interest rate advantage, sustaining a firm USD/JPY stance.
Notably, escalating geopolitical tensions worldwide, especially in the Middle East and concerns over US-Israeli-Iran developments, have further intensified safe-haven demand in currency markets, underpinning the dollar’s status. Meanwhile, soaring oil prices have added pressure on Japan’s import-reliant economy, indirectly weakening the yen.
For the average investor, the recent USD/JPY movements reflect growing global uncertainty and increased risk aversion driving demand for the dollar. Investors holding dollar-related assets have benefited from the relative currency strength, while the yen faces multiple headwinds from economic and geopolitical challenges, influencing forex market volatility and asset allocation decisions.
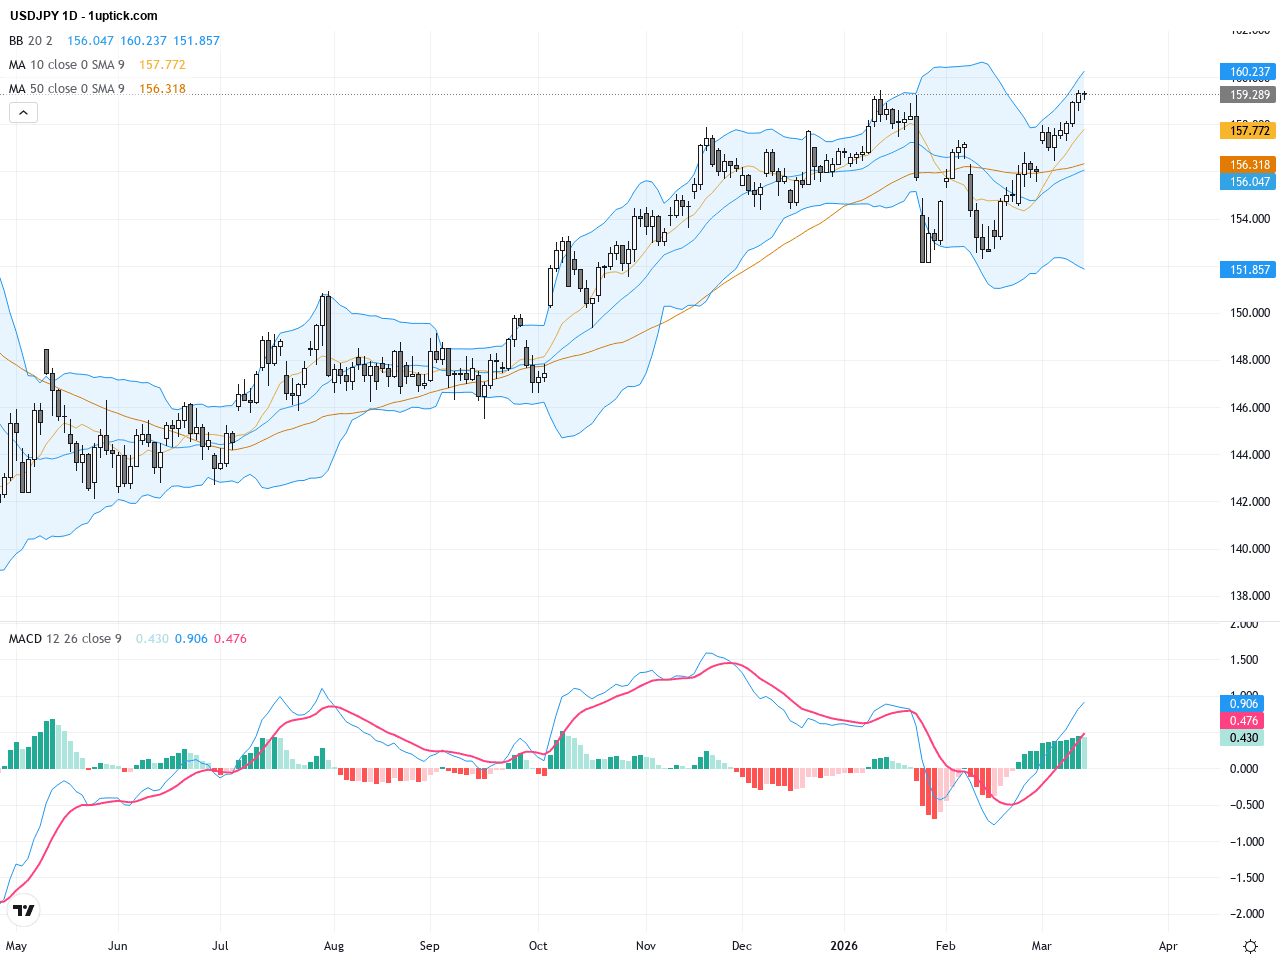
The daily chart displays a clear bullish trend for USDJPY since the beginning of the year, with price consistently staying above both the 50-day and 200-day moving averages. The Bollinger Bands are expanding, indicating increasing volatility, and prices have frequently touched the upper band, signaling strong buying pressure. The MACD histogram shows growing positive momentum with the fast line above the slow line, confirming sustained bullish momentum. Overall, the daily chart suggests continued upward potential, though traders should watch for resistance near the yearly high at 159.4.

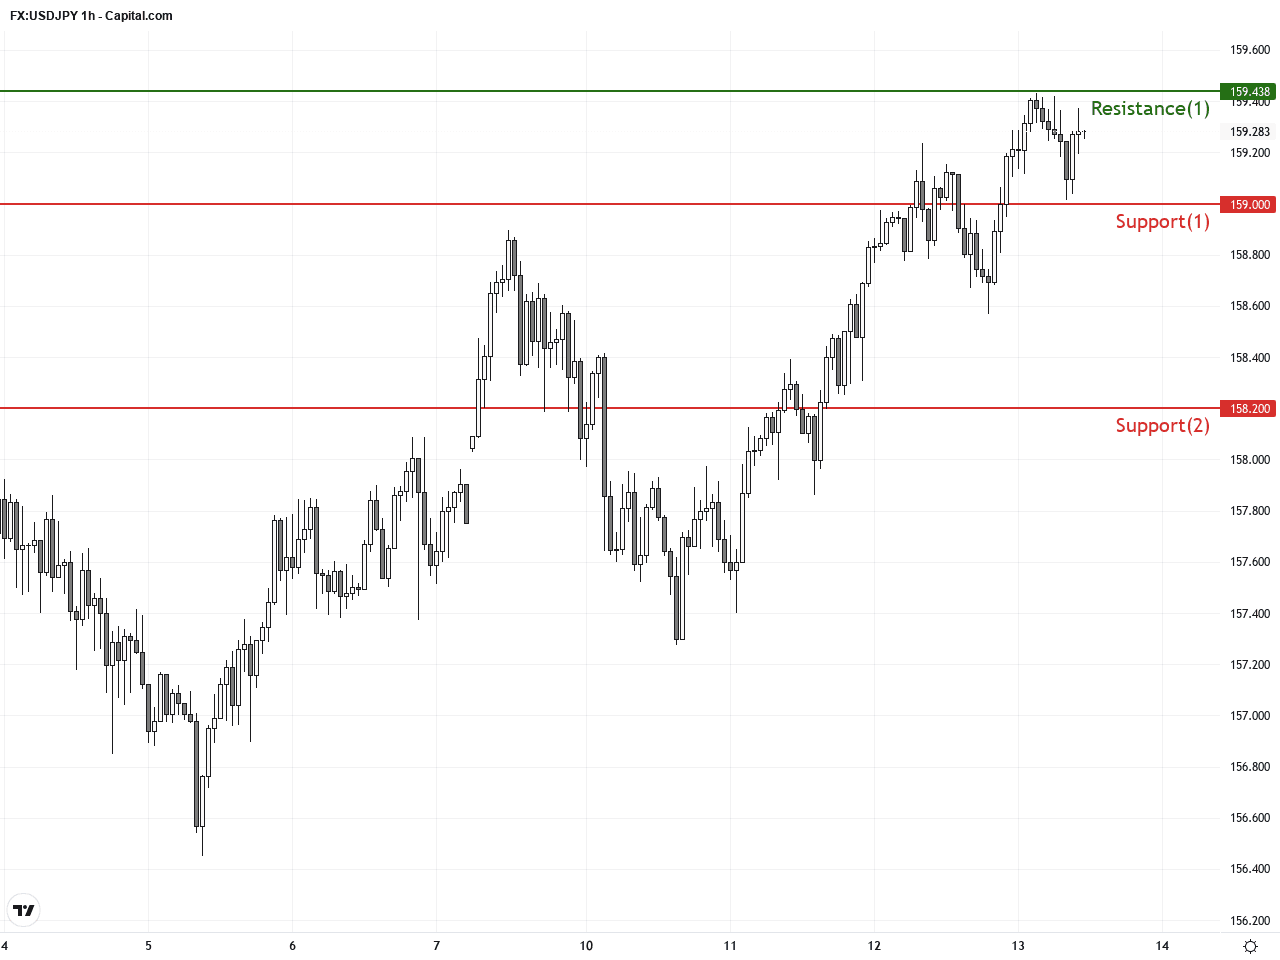
On the hourly chart over the past 5 days, USDJPY shows a gradual uptrend, with prices firmly above the 20- and 50-period moving averages. The recent bullish MACD crossover along with RSI levels between 60-70 indicate active buying in the short term. The middle Bollinger Band acts as dynamic support, with price bouncing off this level multiple times. Notably, large bullish candlesticks have formed recently, reinforcing the strength of buyers and suggesting a probable continuation of the upward momentum in the next 24 hours.
Technical Trend: The USDJPY is currently in a decisively bullish trend, characterized by strong momentum and limited pullbacks, with overall market sentiment favoring buyers.
Technical insights reveal a sustained bullish MACD alignment and a recent golden cross on the hourly chart accompanied by rising volume, indicating an imminent breakout potential. Recent large bullish candlesticks and expanding Bollinger Bands reflect strong market sentiment. Traders should watch for an RSI overbought signal as well as a decisive break above the critical yearly high of 159.438, which could trigger the next phase of bullish momentum.Today’s economic calendar (GMT+1) highlights several releases from the UK, EU, and US. While UK GDP and industrial production data might affect GBP, their impact on USDJPY is minimal. Key U.S. indicators such as the PCE Core Price Index and revised GDP figures at 13:30 local US time will provide important cues for the dollar. Stronger-than-expected data could bolster the USDJPY pair higher, while disappointing figures may trigger a short-term pullback. Overall, there are no major direct events today that are expected to disrupt the current USDJPY trend.
Resistance & Support
The above financial market data, quotes, charts, statistics, exchange rates, news, research, analysis, buy or sell ratings, financial education, and other information are for reference only. Before making any trades based on this information, you should consult independent professional advice to verify pricing data or obtain more detailed market information. 1uptick.com should not be regarded as soliciting any subscriber or visitor to execute any trade. You are solely responsible for all of your own trading decisions.