


 |
| Gold V.1.3.1 signal Telegram Channel (English) |
WTI Crude Oil: Key Support and Technical Patterns Under Pressure Amid Iran Ceasefire Talks
2026-03-26 @ 06:04
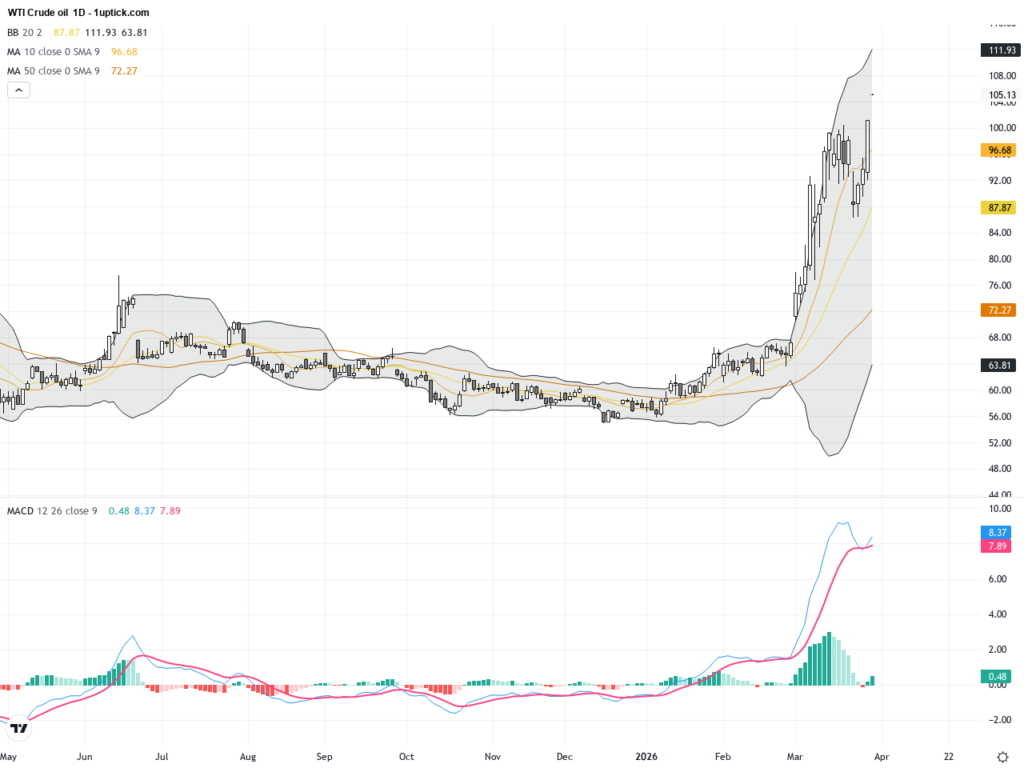
Over the past 48 hours, WTI crude oil prices have experienced significant volatility. From a closing price of $92.35 on March 24, prices slid to $90.32 by March 25, reflecting heightened uncertainty amid geopolitical developments. Notably, reports of US-Iran ceasefire talks sparked a sharp sell-off, pushing crude oil prices down more than 7%, nearing the critical psychological threshold below $100 per barrel.
Latest market news highlights the US proposal for peace talks, which was initially rejected by Iran but nonetheless weighed heavily on oil prices. Trading volumes surged as the Hyperliquid HIP-3 platform reached a record $5.4 billion in single-day volume on March 23, underscoring strong market activity in commodity trading, especially crude oil. This shows investors are actively managing risk and repositioning as hope for de-escalation grows.
For everyday investors, these developments signal that oil prices are moving off the highs driven by previous conflict fears, but volatility remains elevated in the near term. While there is hope for peace, any diplomatic updates could trigger new price swings. Investors should closely monitor the negotiations and how quickly US shale producers can ramp up output, as the supply remains tight for now, leaving the oil price floor uncertain.
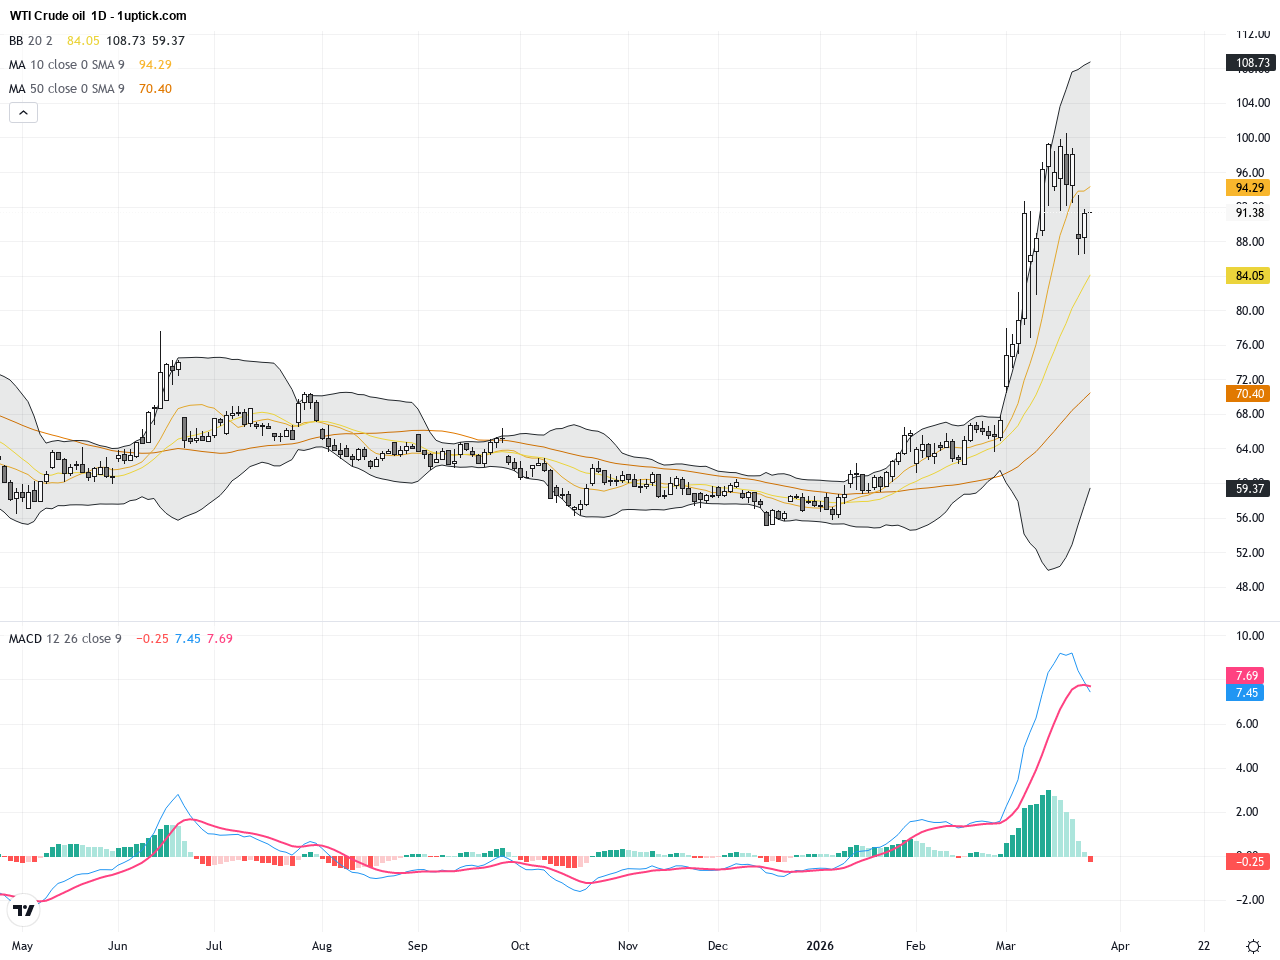
The daily chart illustrates WTI’s descent from a mid-March peak of $115.58 to approximately $90, forming a clear downtrend. The 20-day and 50-day moving averages have crossed bearish, indicating medium-term selling pressure. Bollinger Bands are tightening, suggesting declining volatility and a potential trend reversal. MACD remains negative but is approaching the zero line, signaling a possible short-term bounce. Overall, WTI is compressing near critical support levels awaiting a breakout or breakdown.
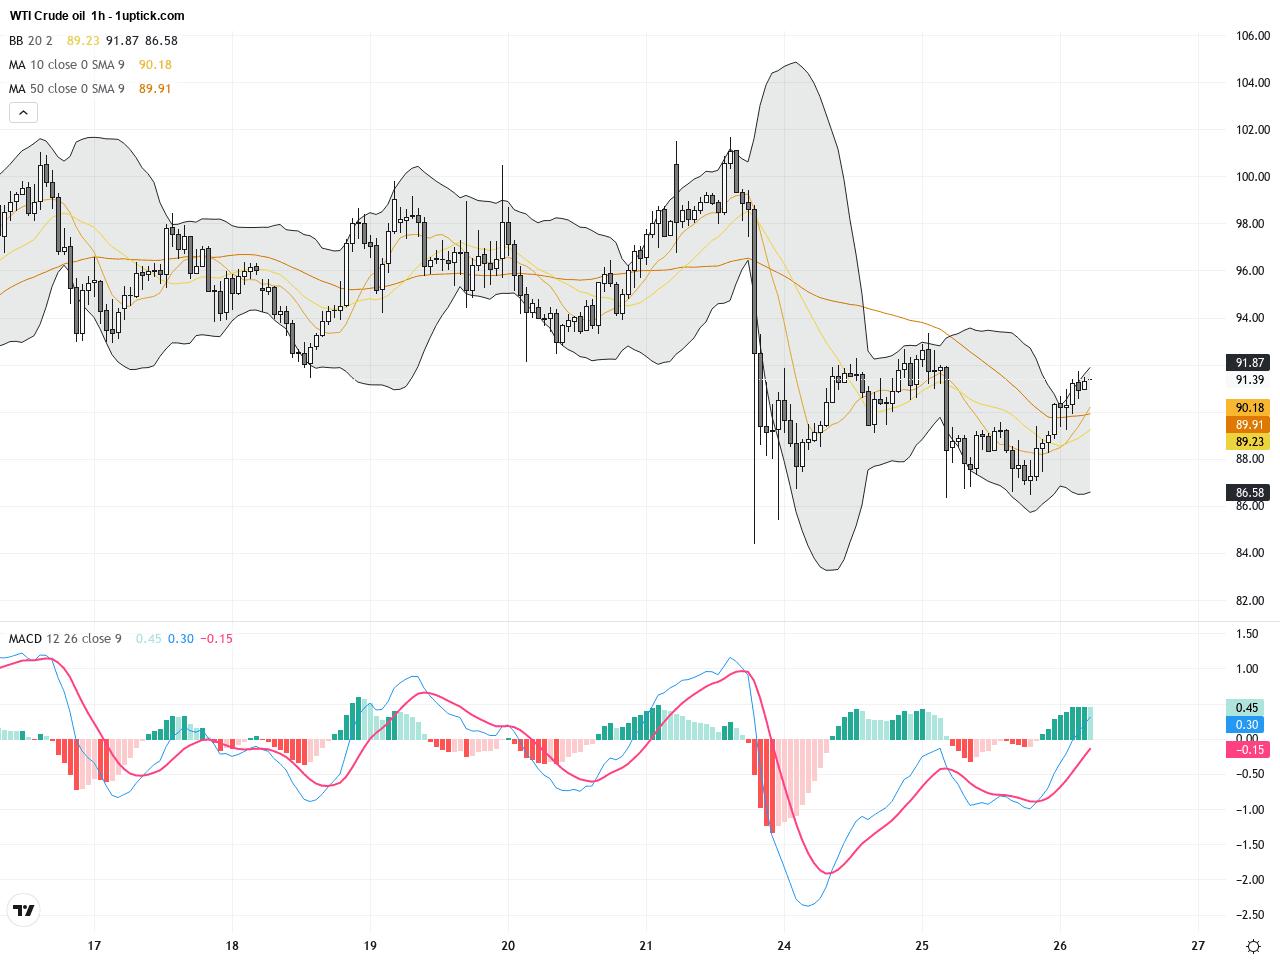
On the hourly timeframe, WTI has exhibited high volatility over the last 3-5 days, with an attempted breakout above $91.7 met by resistance creating an initial head and shoulders pattern. Short-term moving averages (5 and 10) are intertwined, while the MACD is showing a bullish crossover, suggesting momentum may be consolidating for a possible rebound. The mid-Bollinger Band near $89 is acting as support; a close above this level in the next 12-24 hours could trigger a short-term technical rally. Monitoring volume for confirmation is critical.
Technical Trend: Consolidation
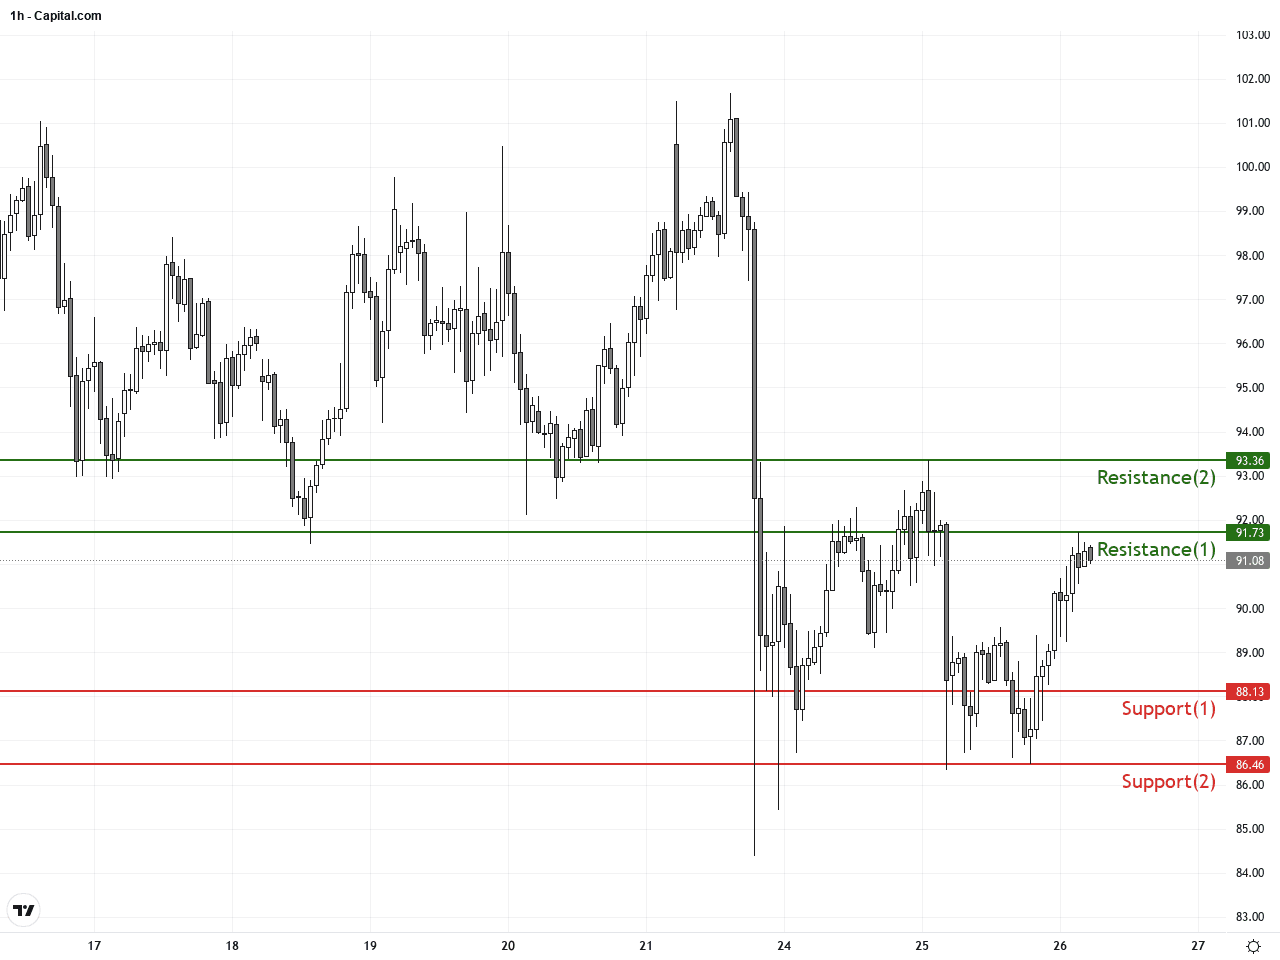
WTI’s technical setup highlights a tug-of-war between bulls and bears, with a nascent head and shoulders pattern facing significant resistance. The daily moving average crossover and narrowing Bollinger Bands reflect cautious investor sentiment. Meanwhile, the hourly MACD bullish crossover and key support holding indicate short-term potential for a bounce. Traders should watch volume and price action around these critical levels to identify high-probability trade setups amid fundamental uncertainties.Today’s economic calendar (GMT+1) does not feature any significant data releases or events directly impacting WTI crude oil prices. Given the current geopolitical environment, oil markets will likely remain reactive mainly to diplomatic developments rather than scheduled economic reports.
Resistance & Support
The above financial market data, quotes, charts, statistics, exchange rates, news, research, analysis, buy or sell ratings, financial education, and other information are for reference only. Before making any trades based on this information, you should consult independent professional advice to verify pricing data or obtain more detailed market information. 1uptick.com should not be regarded as soliciting any subscriber or visitor to execute any trade. You are solely responsible for all of your own trading decisions.