


 |
| Gold V.1.3.1 signal Telegram Channel (English) |

WTI Crude Oil: Key Support Holds After Sharp Selloff, Critical Trading Outlook
2026-03-24 @ 06:03
Over the past 24 to 48 hours, WTI crude oil prices experienced extreme volatility, closing yesterday at $88.13 per barrel, marking a sharp drop of around 11% from the previous day. This sharp decline was primarily triggered by U.S. President Trump’s announcement of “productive talks” with Iran and his decision to put a hold on strikes targeting Iran’s energy infrastructure. This diplomatic easing quickly subdued oil prices that had been driven higher by Middle East geopolitical tensions.
Specifically, Trump’s social media statement about postponing attacks on Iranian power plants significantly eased fears of an escalation in conflict, leading to a more than 10% drop in oil prices early Monday. For investors, this indicated a short-term relief in risk-off sentiment in the oil market, causing a notable correction and highlighting the market’s sensitivity to geopolitical news.
Overall, recent price movements in WTI crude oil have been clearly news-driven, reflecting heightened volatility amid the intersection of geopolitical friction and diplomatic negotiations. For average investors, understanding how such news instantly impacts the market helps in seizing trading opportunities amid volatility and avoiding unnecessary losses triggered by panic-driven moves.
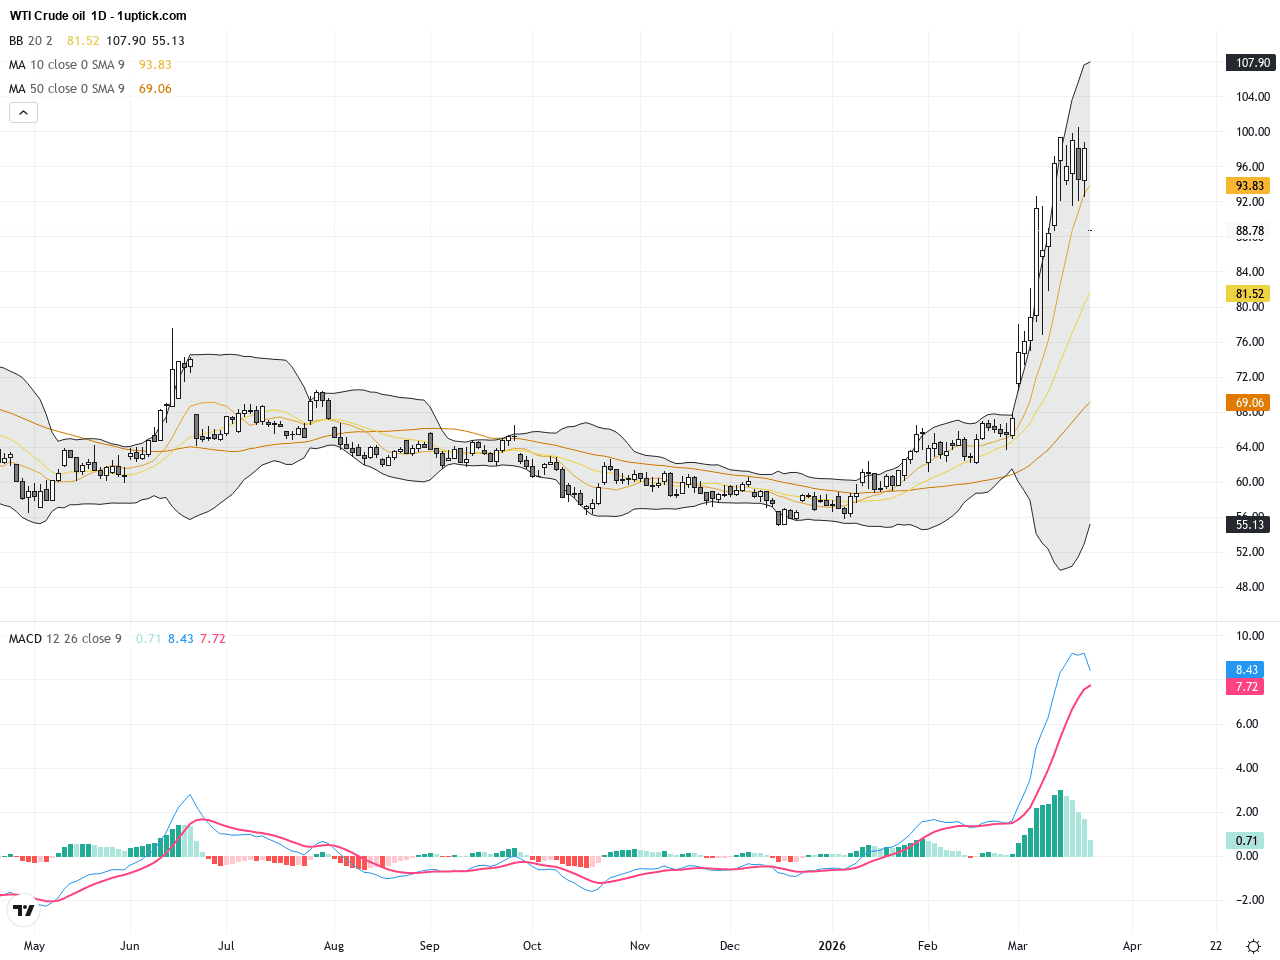
The WTI Crude Oil daily chart reveals that after surging above the crucial $100 psychological level earlier this month, prices faced strong resistance amid geopolitical tensions. Since March 20, the price swung sharply downwards, culminating in a steep drop on March 23 to $88.13. The closing price pierced below key moving averages including the 20-day and 50-day MA, signaling intensified short-term selling pressure. The Bollinger Bands have widened considerably, highlighting increased volatility, while the MACD histogram flipped into negative territory, suggesting a momentum shift from bullish to bearish. Overall, the daily chart points to a pronounced short-term correction amid a still uncertain medium-term trend.
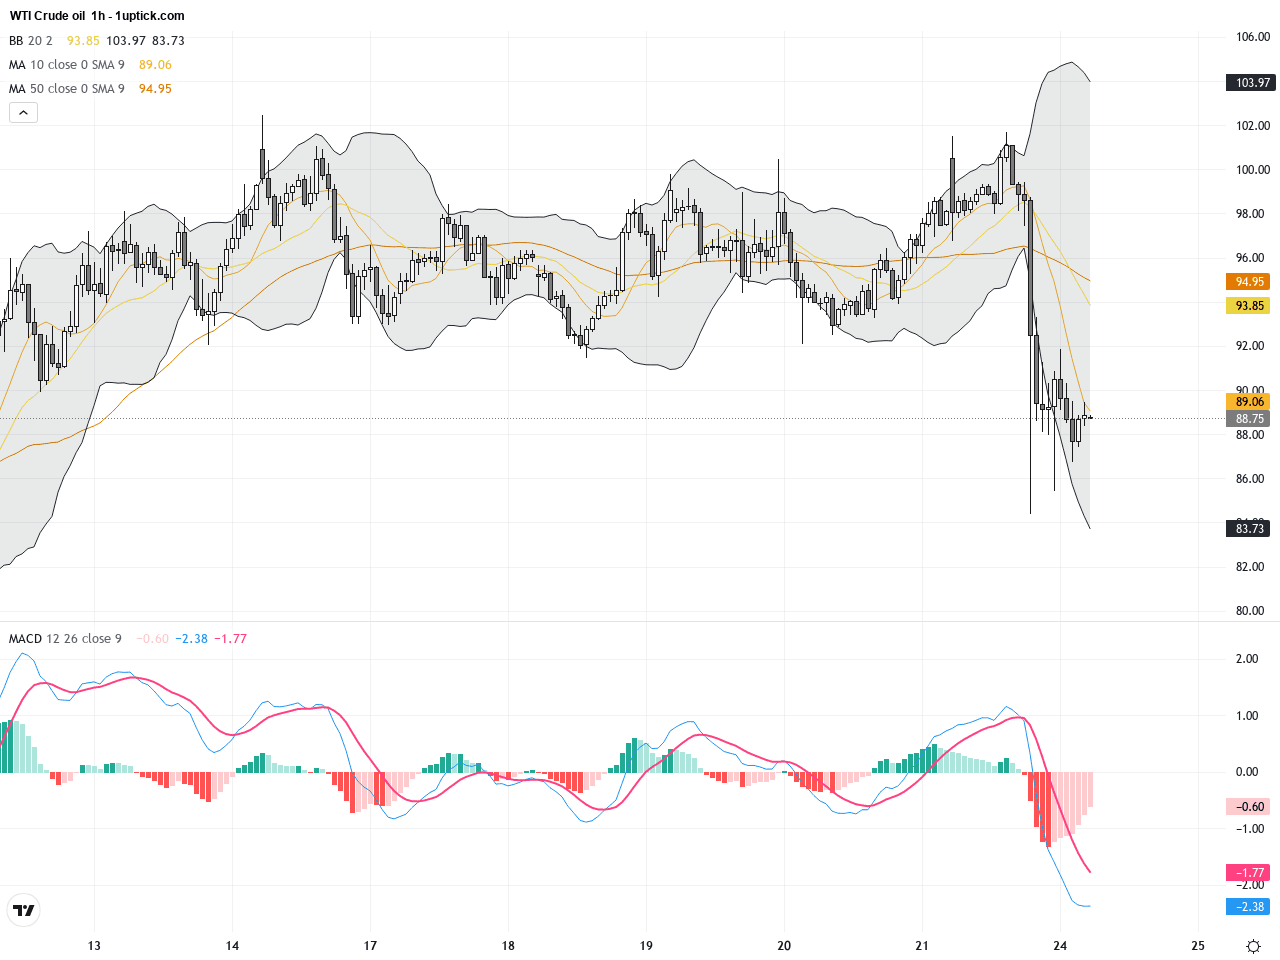
The hourly chart shows wild swings over the last 3–5 days, particularly marked by the steep decline on March 23 followed by tentative rebounds. Short-term moving averages are intertwined, illustrating a lack of clear directional bias. Bollinger Bands have started to contract, suggesting a temporary volatility slowdown. Importantly, the MACD recently formed an initial golden cross, hinting at potential short-term bullish momentum. The current price nears an hourly support zone, and the formation of a hammer candlestick pattern indicates possible easing of downward pressure, which could lead to a bounce in the near term.
Technical Trend: Short-term trend: Sideways consolidation; Medium-term trend: Cautiously bearish
Technical signals indicate WTI Crude Oil is battling critical support levels with mixed momentum cues. While the daily MACD histogram remains negative, pointing to bearish pressure, the hourly MACD golden cross suggests a near-term rebound may be forming. The recent hammer candlestick adds to this bullish possibility. Traders should watch for increased volume as it may precede a directional breakout. Price consolidation near support levels suggests the next 1–2 trading days will be pivotal for determining if bulls regain control or if the downtrend continues.There are no major economic events scheduled today that are directly relevant to WTI Crude Oil. The commodity’s price action remains primarily influenced by geopolitical developments and supply-demand fundamentals.
Resistance & Support

The above financial market data, quotes, charts, statistics, exchange rates, news, research, analysis, buy or sell ratings, financial education, and other information are for reference only. Before making any trades based on this information, you should consult independent professional advice to verify pricing data or obtain more detailed market information. 1uptick.com should not be regarded as soliciting any subscriber or visitor to execute any trade. You are solely responsible for all of your own trading decisions.