


 |
| Gold V.1.3.1 signal Telegram Channel (English) |

WTI Crude Oil: Middle East Tensions Drive Record Brent-WTI Spread Amid Strong Technical Rebound
2026-03-19 @ 06:03
Over the past 24 to 48 hours, the WTI crude oil market has shown significant volatility. On March 18, the closing price reached $99.05 per barrel, marking a notable rise from the previous day. The primary catalyst was instability in the Middle East, particularly Iran’s attacks on Saudi Arabia’s gas facilities, which heightened concerns about global oil supply tightness, pushing prices upward. Additionally, the discount of U.S. crude futures relative to Brent crude widened to its largest gap in 11 years, highlighting the direct impact of Middle Eastern supply risks on the international oil pricing structure.
This news translates into the WTI price dynamics as investors grew cautious about potential disruptions to the vital Strait of Hormuz shipping route, triggering increased risk aversion and thus upward pressure on oil prices. At the same time, U.S. exports have surged because the steep price discount made American crude more attractive overseas. This dual effect on supply and demand has given WTI remarkable resilience in the short term.
For everyday investors, this serves as a reminder that geopolitical risks remain a critical factor influencing energy markets. With ongoing turbulence in international politics, oil prices are prone to swift and sharp fluctuations. Investors should closely monitor the latest market news and developments to better anticipate price movements and adjust their portfolios accordingly.
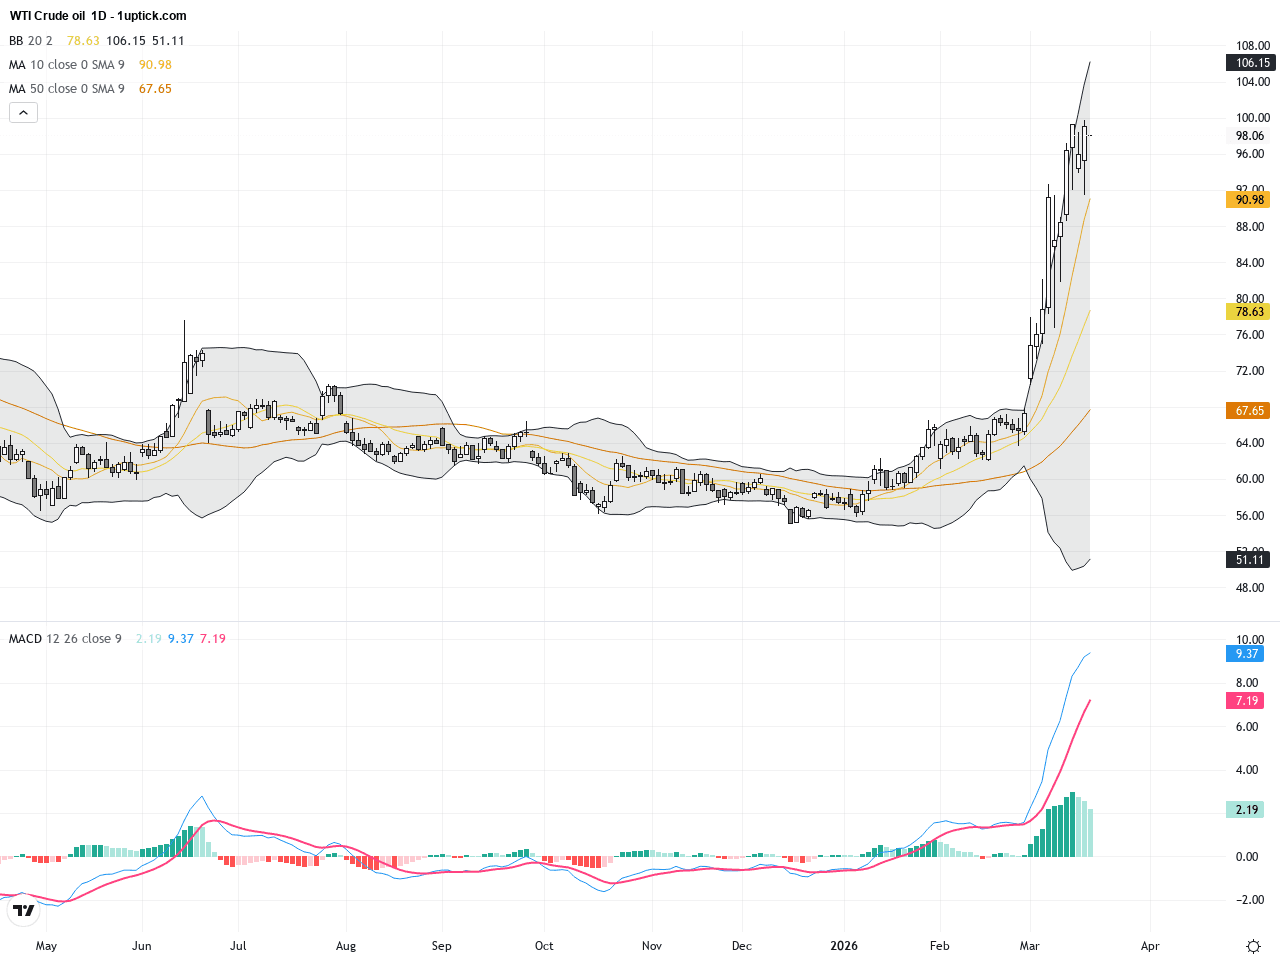
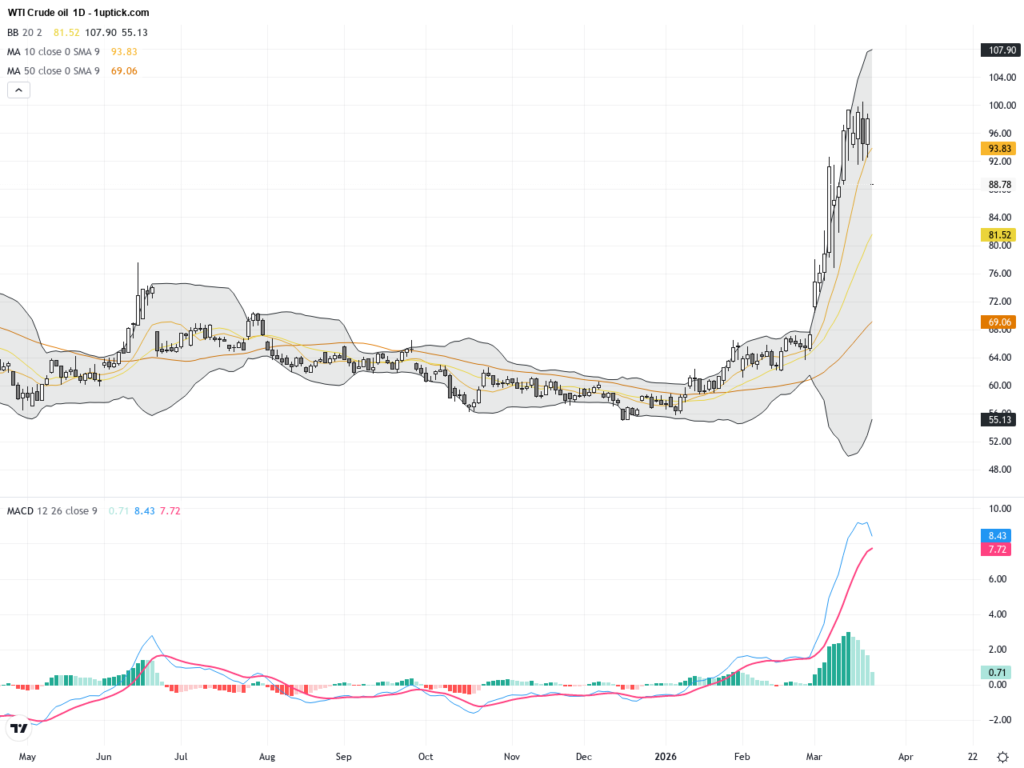
The daily chart of WTI Crude Oil shows significant volatility starting mid-March, with prices oscillating between $92 and $99 before a recent breakout above the 100-day moving average on March 18. The Bollinger Bands have begun to widen upward, indicating acceleration in buying momentum. The MACD has crossed above its signal line and rose above zero, reinforcing a bullish trend signal. The overall daily trend suggests a strong recovery with technical bias leaning bullish in the medium term.
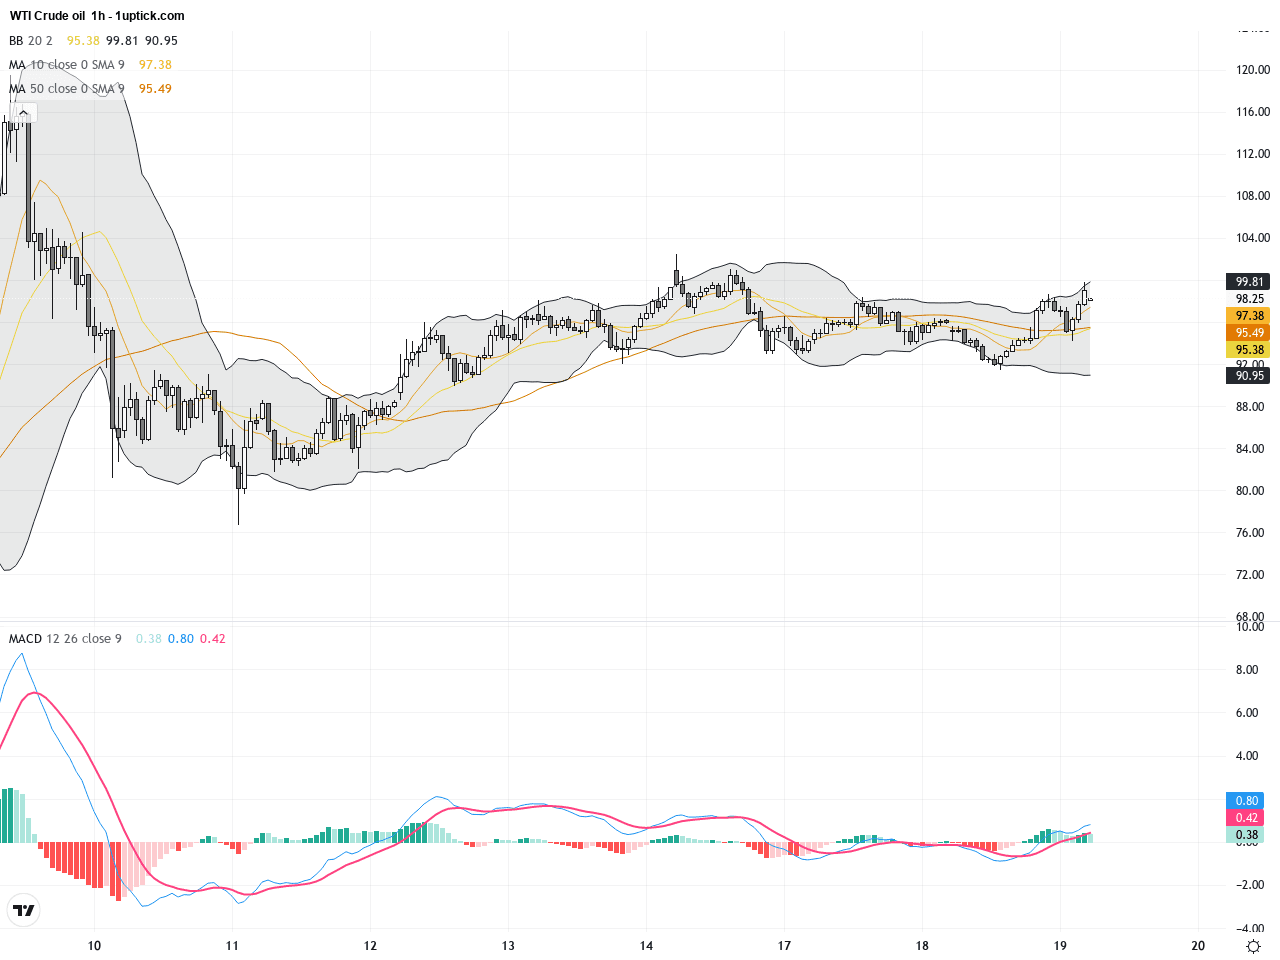
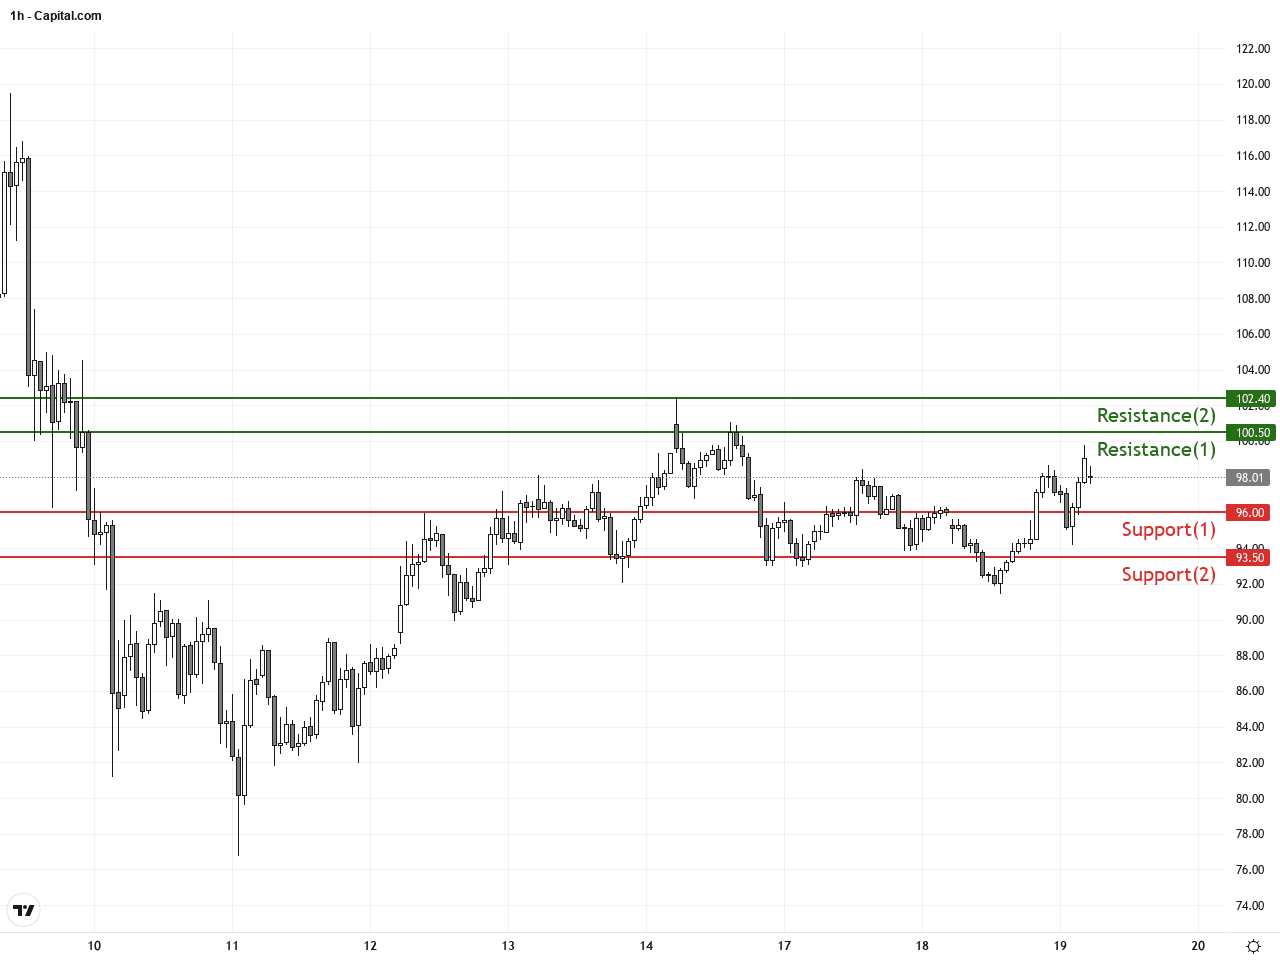
On the hourly chart, WTI oil exhibited increased volatility in the last 3-5 days, trading mostly between $96 and $99. The 50-hour moving average has started to curve up and is about to cross above the 100-hour moving average, suggesting a potential golden cross and a short-term bullish trend. Bollinger Bands expansion confirms heightened volatility. The MACD shows consistent momentum gains, supporting the probability of continued price strength in the next 24 hours. A recent hammer candlestick pattern indicates buying support near current levels.
Technical Trend: WTI crude oil currently exhibits a cautiously bullish trend, with technical and fundamental factors supporting sustained upward momentum alongside volatile price swings.
Technically, WTI crude oil benefits from a bullish MACD crossover and an impending golden cross on hourly charts, supported by the daily chart’s breakout above the 100-day moving average. Combined with fundamental supply concerns due to Middle Eastern tensions, the price is poised for further upside potential. Watch the resistance zone around $98-$100 closely, as it could challenge bullish momentum or trigger pullbacks.There are no significant or directly relevant economic events scheduled today (March 19, 2026) that would impact WTI Crude Oil. Market participants should continue focusing on geopolitical developments in the Middle East, which remain the primary driver of price volatility.
Resistance & Support
The above financial market data, quotes, charts, statistics, exchange rates, news, research, analysis, buy or sell ratings, financial education, and other information are for reference only. Before making any trades based on this information, you should consult independent professional advice to verify pricing data or obtain more detailed market information. 1uptick.com should not be regarded as soliciting any subscriber or visitor to execute any trade. You are solely responsible for all of your own trading decisions.