
 |
| Gold V.1.3.1 signal Telegram Channel (English) |

WTI Crude Oil: Middle East Tensions Fuel Volatility as Triangle Pattern Emerges
2026-03-12 @ 06:03
Over the past 24 to 48 hours, WTI crude oil prices have shown significant volatility, closing yesterday at $87.25, marking a clear rebound from earlier days. The market has been highly volatile over the past week, driven primarily by geopolitical tensions in the Middle East and international energy policy responses.
Recently, Iran announced it would prevent oil shipments through the Strait of Hormuz, sending shockwaves through global markets and pushing oil prices near the $120 per barrel mark. Meanwhile, the International Energy Agency (IEA) unusually declared it will release 400 million barrels of emergency oil reserves to ease market panic and stabilize prices. Despite this emergency release announcement, oil prices remain elevated, highlighting the market’s deep concerns over Middle East uncertainties.
For everyday investors and consumers, this situation is akin to a sudden power outage causing instability in electricity supply, driving up overall living costs. The surge in oil prices directly translates to higher gasoline prices, with Florida seeing average pump prices climb by 20%, hitting drivers hard at the pump. Even with governments releasing emergency reserves to counter rising prices, the short-term relief appears limited, signaling investors to closely monitor developments in Middle East politics and global energy supply chain pressures.
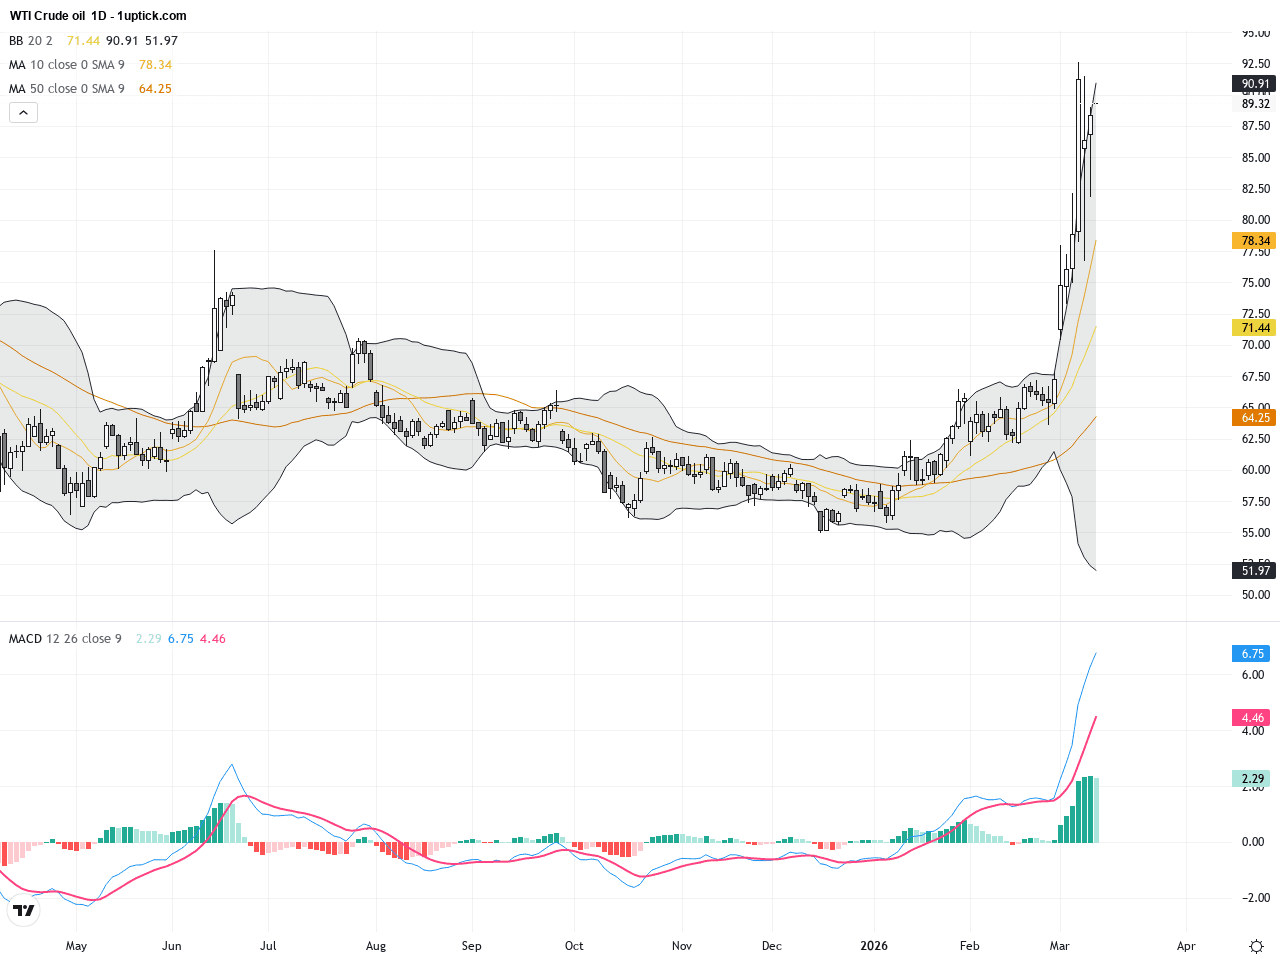
The WTI Crude daily chart reveals a broad volatile trend. The price surged sharply from about $62 to $120, then consolidated into a defined contracting triangle pattern. Currently, prices hover near the lower boundary of this triangle, indicating a tight contest between bulls and bears. The daily 50-day and 200-day moving averages have formed a golden cross, suggesting short-term bullish momentum. However, the Bollinger Bands are narrowing, signaling an impending breakout. The MACD remains positive but with waning momentum, indicating that market direction is still uncertain.
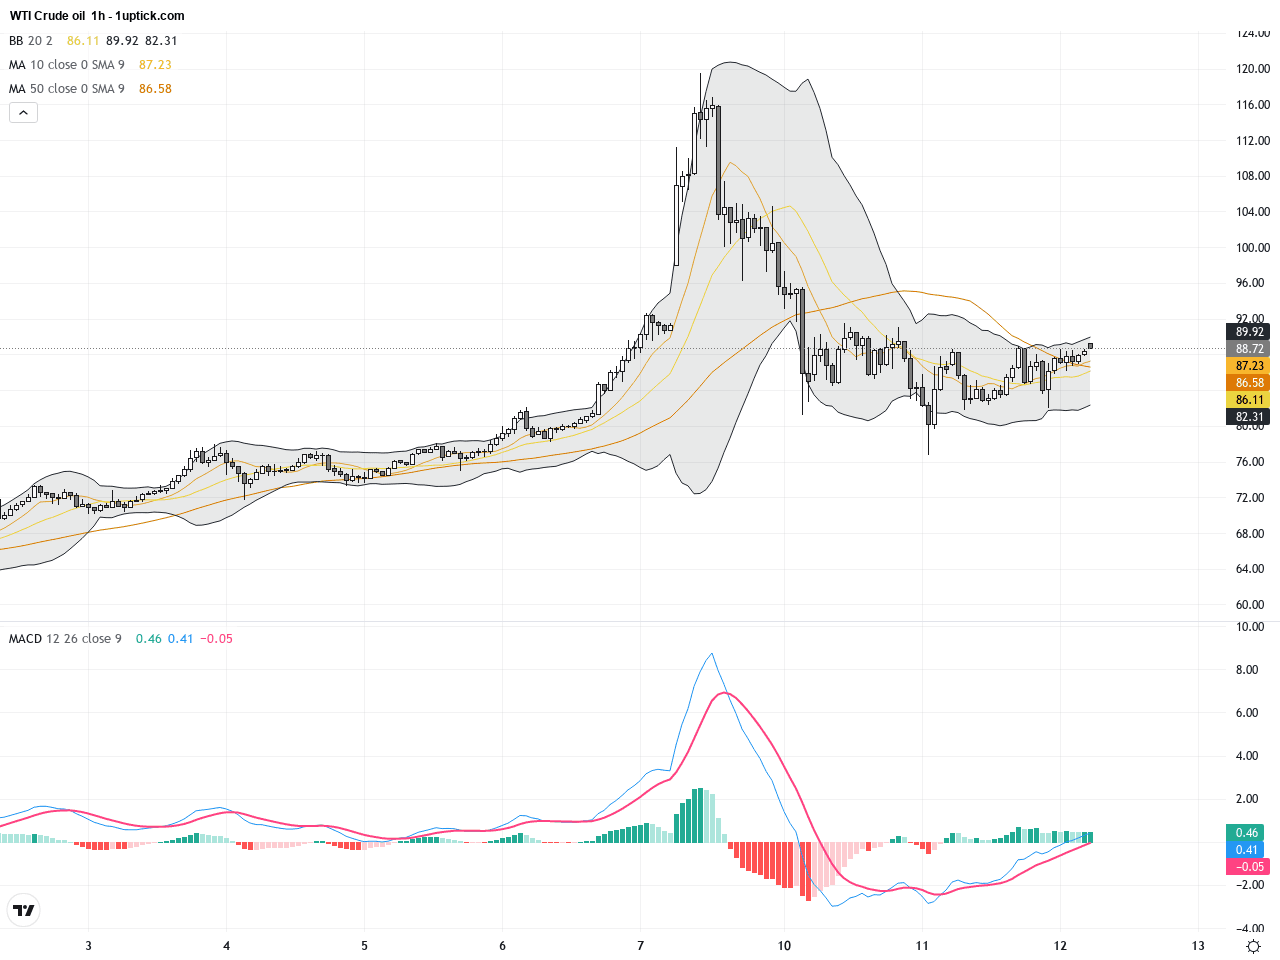
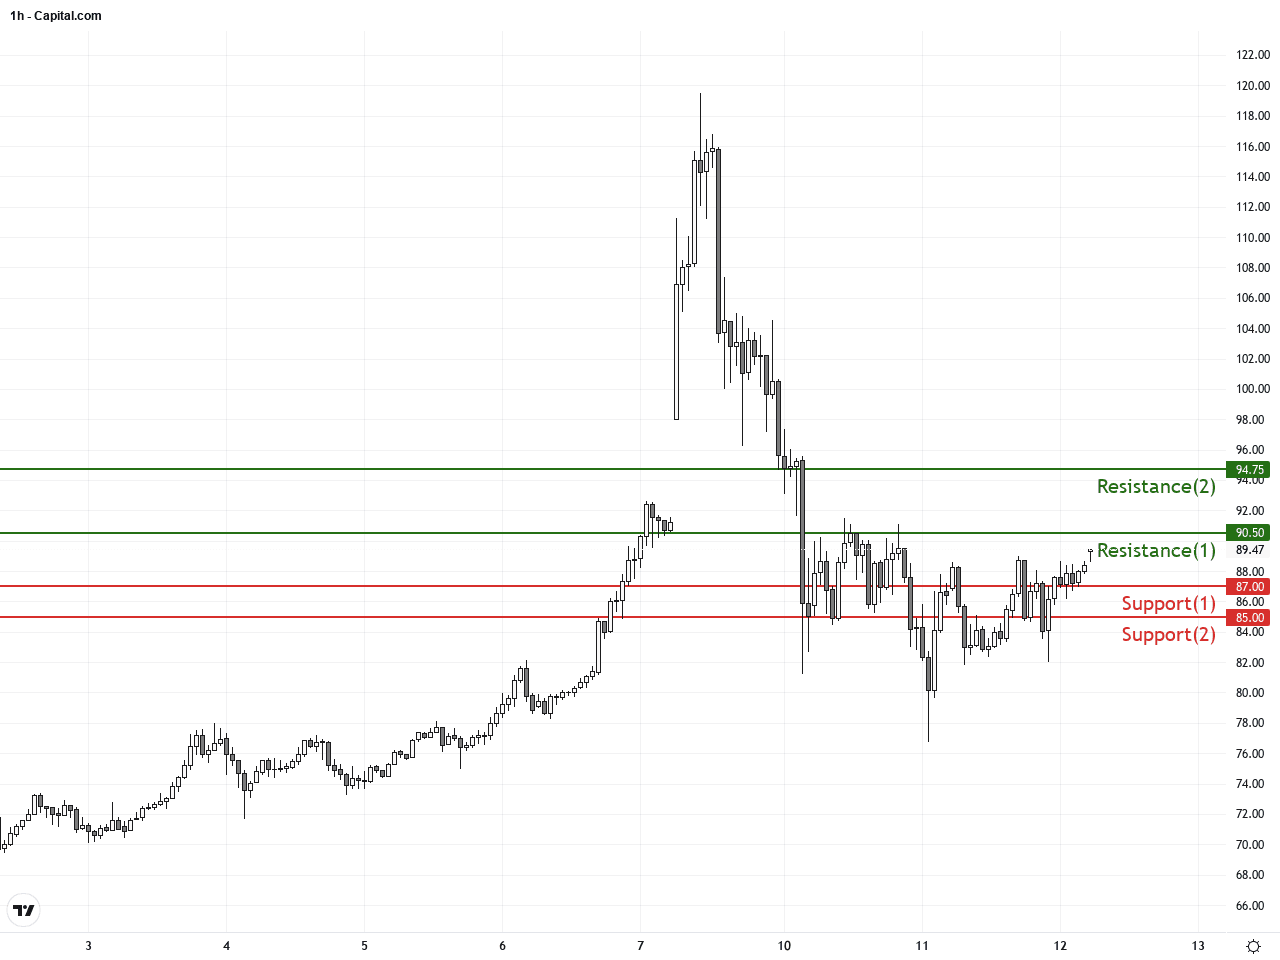
The hourly chart over the last 3 to 5 days shows WTI fluctuating between $85 and $90 in a tight range. Bollinger Band width is decreasing, indicating reducing volatility. The 50-period moving average provides firm support around $87, while the MACD has generated a bullish crossover, suggesting a potential near-term rebound. However, volume has yet to rise significantly, implying limited buying strength. The short-term higher lows form an ascending trendline, which if broken, could signal the next directional shift.
Technical Trend: WTI Crude Oil currently exhibits a cautiously bullish trend, with daily chart consolidation and short-term upward momentum.
Technically, WTI Crude is currently trading within a daily triangle consolidation pattern, with a breakout likely to define the medium-term trend. On the hourly chart, the MACD bullish crossover and support trendline suggest a rebound potential above $87. Given the ongoing supply risks linked to Middle East tensions, abrupt price swings remain possible. Traders should closely monitor volume and technical signals to identify high-probability trade setups.There are no major direct economic events today expected to impact WTI Crude Oil prices. However, ongoing geopolitical developments and energy market news remain key factors influencing oil price volatility.
Resistance & Support
The above financial market data, quotes, charts, statistics, exchange rates, news, research, analysis, buy or sell ratings, financial education, and other information are for reference only. Before making any trades based on this information, you should consult independent professional advice to verify pricing data or obtain more detailed market information. 1uptick.com should not be regarded as soliciting any subscriber or visitor to execute any trade. You are solely responsible for all of your own trading decisions.