


 |
| Gold V.1.3.1 signal Telegram Channel (English) |
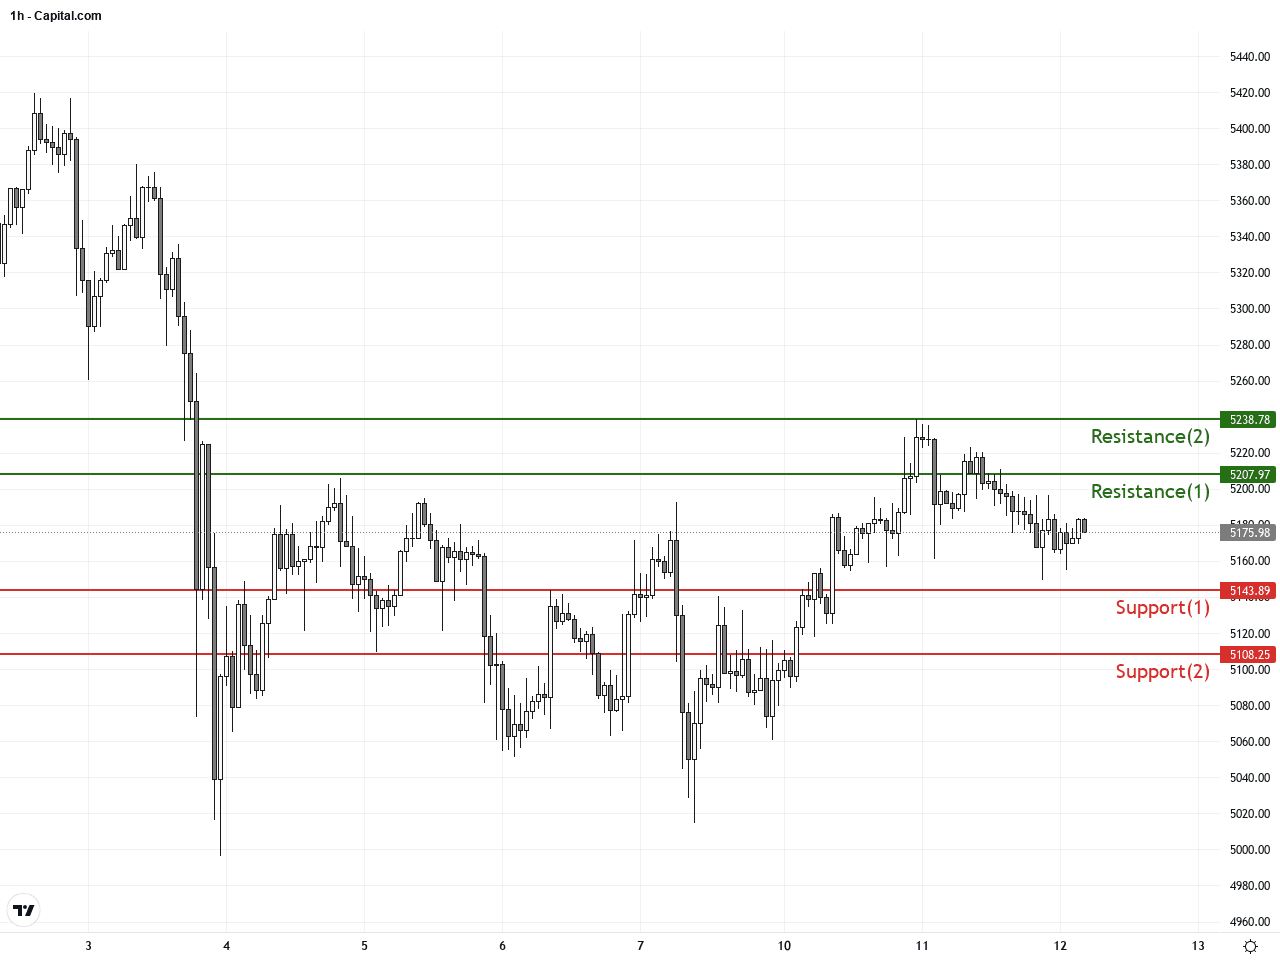
XAUUSD Gold Breaks Key 5207.97 Resistance: Technical and Fundamental Trading Outlook
2026-03-12 @ 05:04
Over the past 24 to 48 hours, gold (XAUUSD) has shown noticeable volatility, closing yesterday at 5176.575 USD. The recent rally was driven by a breakout above the key resistance level near 5207.97 USD, sparking optimism for a further advance. With oil prices nearing $100 per barrel and uncertainty surrounding the Federal Reserve’s interest rate policy, gold has experienced range-bound trading.
Additionally, geopolitical tensions such as the Iran crisis have made the market cautious, while a stronger US dollar and fluctuating energy prices weighed on gold. However, gold prices surged in after-hours trading following remarks by President Trump suggesting an end to the conflict in the Middle East might be near, underscoring continued safe-haven demand. This upward momentum is also supported by growing market expectations for potential Fed rate cuts, bolstering gold’s appeal.
For the average investor, this price action highlights the current market’s uncertainty but also underscores opportunity. When energy markets and geopolitical risks fluctuate, gold’s role as a safe-haven asset intensifies, making it a crucial element in portfolio diversification. Investors should closely monitor oil prices and US interest rate developments as these factors are poised to directly influence gold’s trajectory.

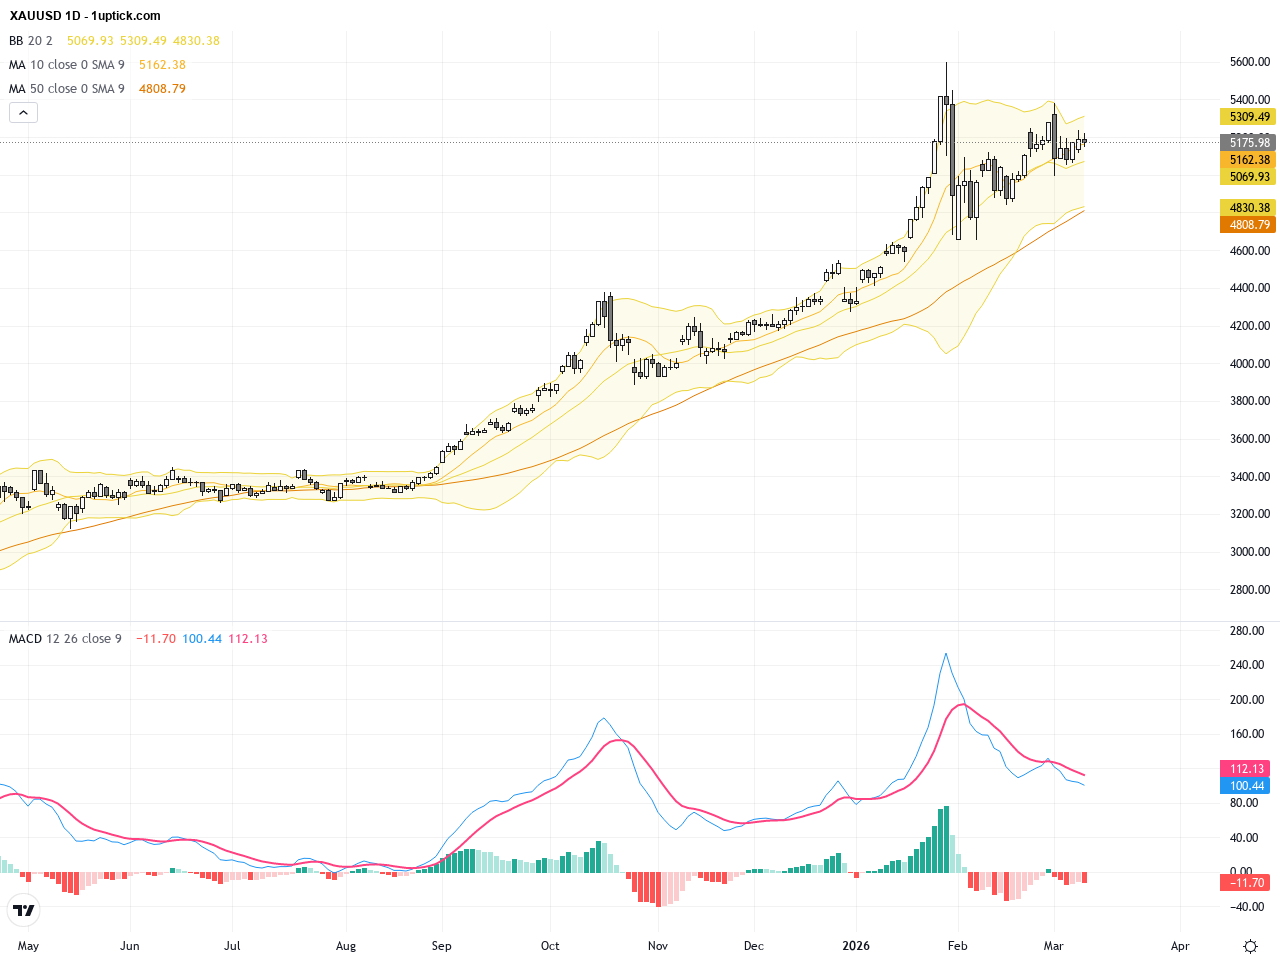
The daily chart shows a mild uptrend recovery in XAUUSD, as prices climb from roughly 5100 lows towards the 5200 psychological level. Short-term moving averages have formed a bullish crossover, indicating improving momentum. The Bollinger Bands are widening, signaling increased volatility. MACD remains above zero and trends upward, supporting further price gains. However, the critical 5207.97 resistance still stands as a significant hurdle; failure to break could lead to a pullback.

On the 3-5 day hourly chart, XAUUSD has staged a clear rebound after holding support near the channel bottom. Prices have tested and partially breached the 5200 resistance level several times. Short-term moving averages exhibit bullish alignment, while narrowing Bollinger Bands suggest consolidation before a potential breakout. MACD shows a golden cross above zero, and RSI trends upward, implying strengthening buying pressure. Recent candle formations include bullish engulfing and a morning star pattern signaling a favorable short-term outlook.
Technical Trend: Cautiously Bullish
Technically, XAUUSD remains comfortably above key support at 5143.89, with bullish MACD and moving average crossovers on the daily chart reinforcing upward momentum. The hourly chart’s morning star pattern and rising RSI further confirm short-term buying strength. The critical resistance level at 5207.97 will be the decisive zone – a successful breakout here would likely trigger a fresh rally. Trading volumes remain steady, reflecting sustained market interest. Traders should remain cautious of oil price and USD fluctuations influencing gold, especially given imminent US CPI data release.Today’s GMT+1 economic calendar features key data releases from Germany, Slovakia, Spain, and the US, notably the US Consumer Price Index (CPI) at 13:30 GMT+1. The market consensus expects CPI to hold steady at 2.4% year-on-year, in line with previous readings. Should the actual data meet or fall below forecasts, it likely supports gold prices by implying slower or paused Fed tightening. Conversely, higher-than-expected CPI data could bolster the USD and pressure gold downward. Other European data and US oil inventory updates are less likely to have direct immediate effect on XAUUSD.
Resistance & Support
The above financial market data, quotes, charts, statistics, exchange rates, news, research, analysis, buy or sell ratings, financial education, and other information are for reference only. Before making any trades based on this information, you should consult independent professional advice to verify pricing data or obtain more detailed market information. 1uptick.com should not be regarded as soliciting any subscriber or visitor to execute any trade. You are solely responsible for all of your own trading decisions.