 |
| Gold V.1.3.1 signal Telegram Channel (English) |
XAUUSD Technical & Fundamental Report: Gold Stabilizes Near $4733, Bullish Signal Emerges
2026-04-02 @ 22:32
Over the past 24 to 48 hours, gold (XAUUSD) has experienced significant volatility, closing yesterday at $4661.84, down from $4758.2 the day before. During this period, the market saw brief rebounds but was ultimately pressured by renewed geopolitical tensions, resulting in sharp price swings.
Recent market news highlights a tentative rebound in gold and silver prices after a prolonged downward trend, especially as gold stabilizes above $4733, boosting bullish sentiment. However, gold prices fell early Thursday trading after President Trump threatened to strike Iran ‘extremely hard,’ which pushed oil prices higher and increased inflation expectations, thus dampening gold’s appeal as a safe-haven asset.
For the average investor, these market moves mean that while gold maintains its role as a hedge amid geopolitical risks, external policy moves and oil price volatility can trigger short-term swings. Investors should remain vigilant about international developments and policy shifts to manage risks effectively. Overall, the gold market remains in a phase of consolidation, awaiting clear signals to set its next direction.

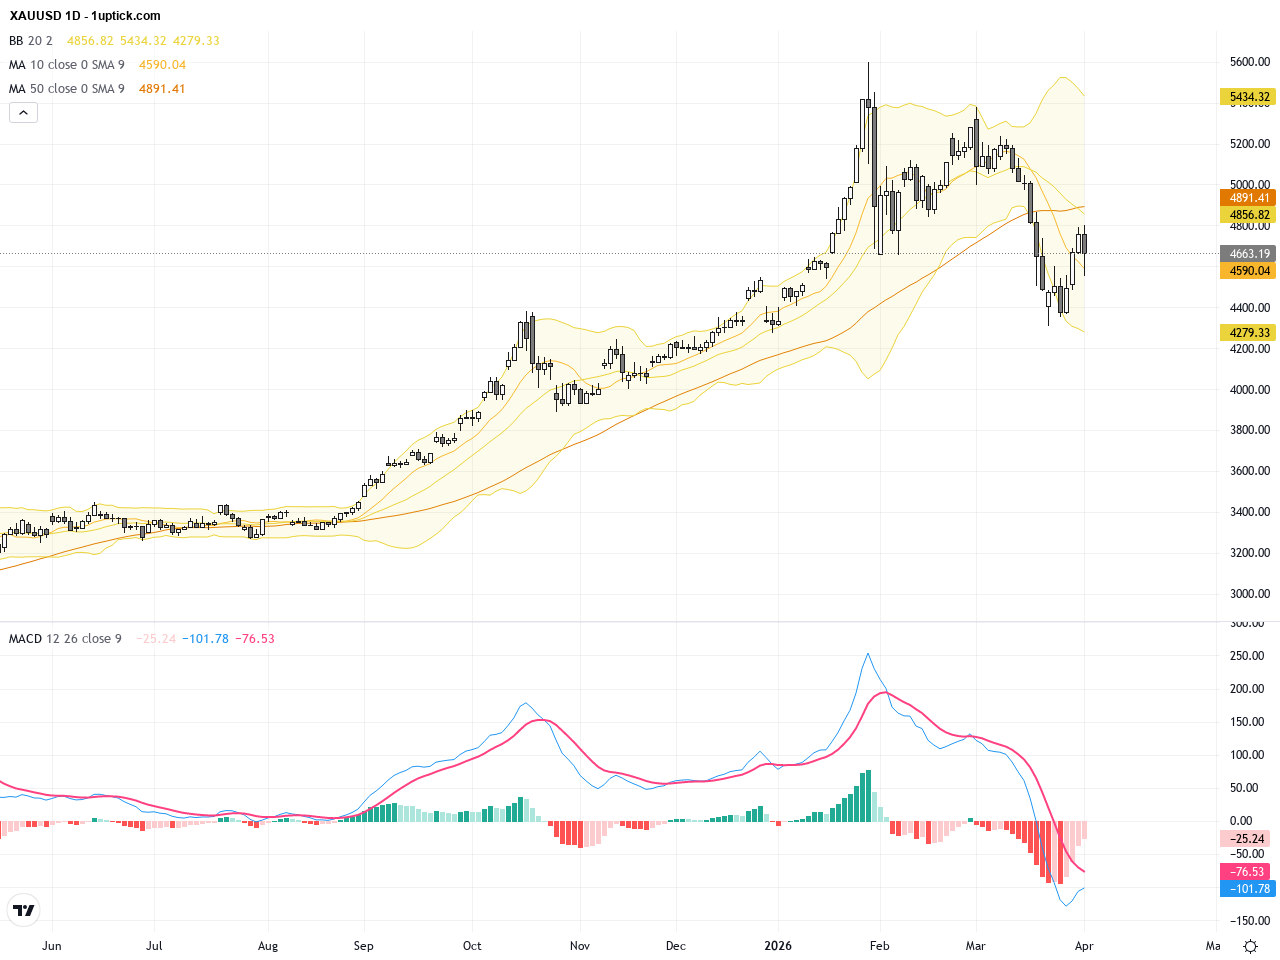
The daily chart shows XAUUSD in a consolidative uptrend since late March, with several bullish candles followed by a corrective pullback near the upper Bollinger Band middle line. The 20- and 50-day moving averages are turning upwards, supporting the bullish trend. MACD histogram is narrowing, indicating loss of momentum but no bearish crossover yet, suggesting the current adjustment might form a base for the next leg up.
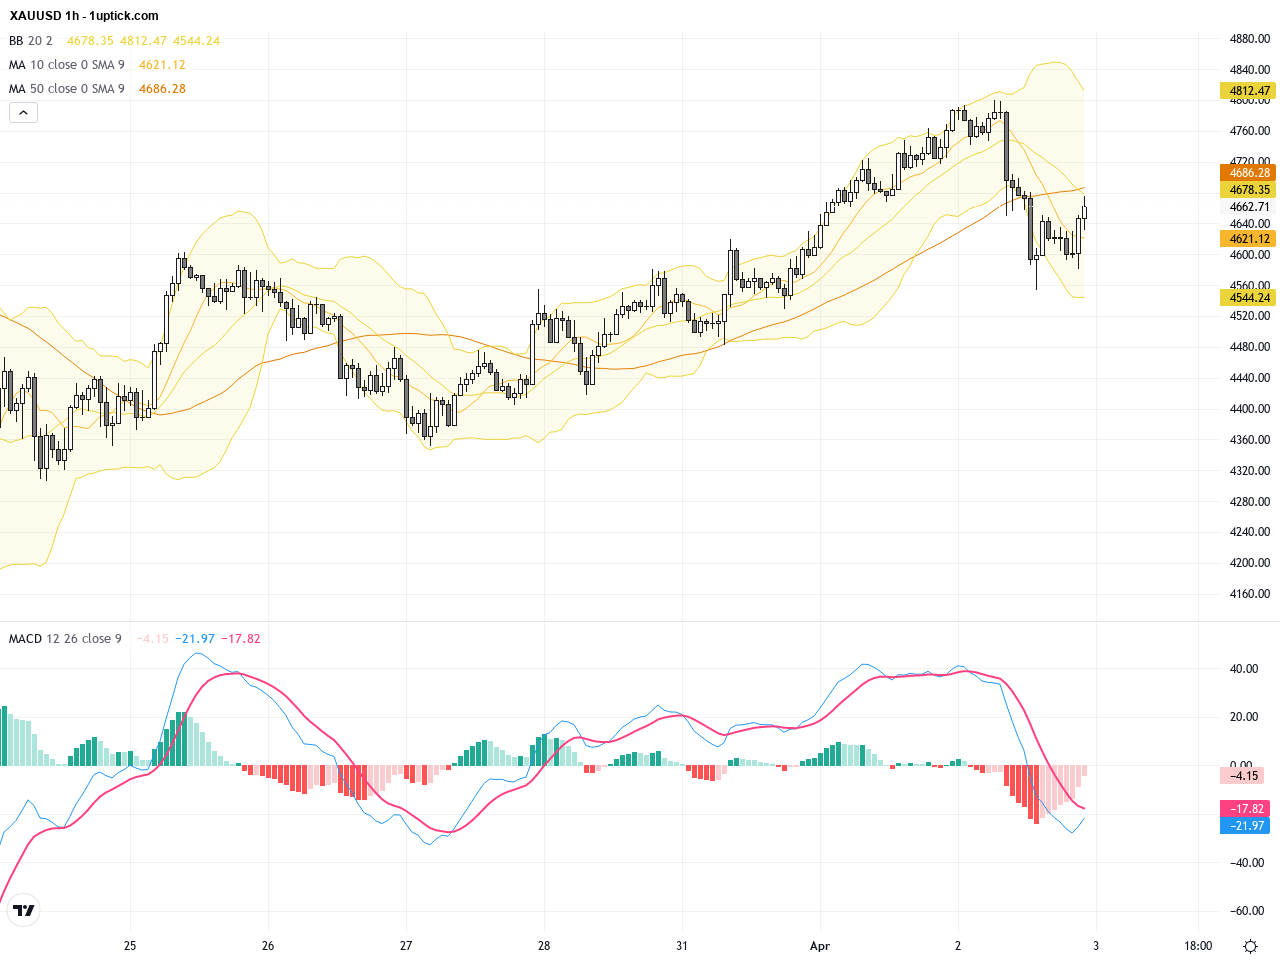
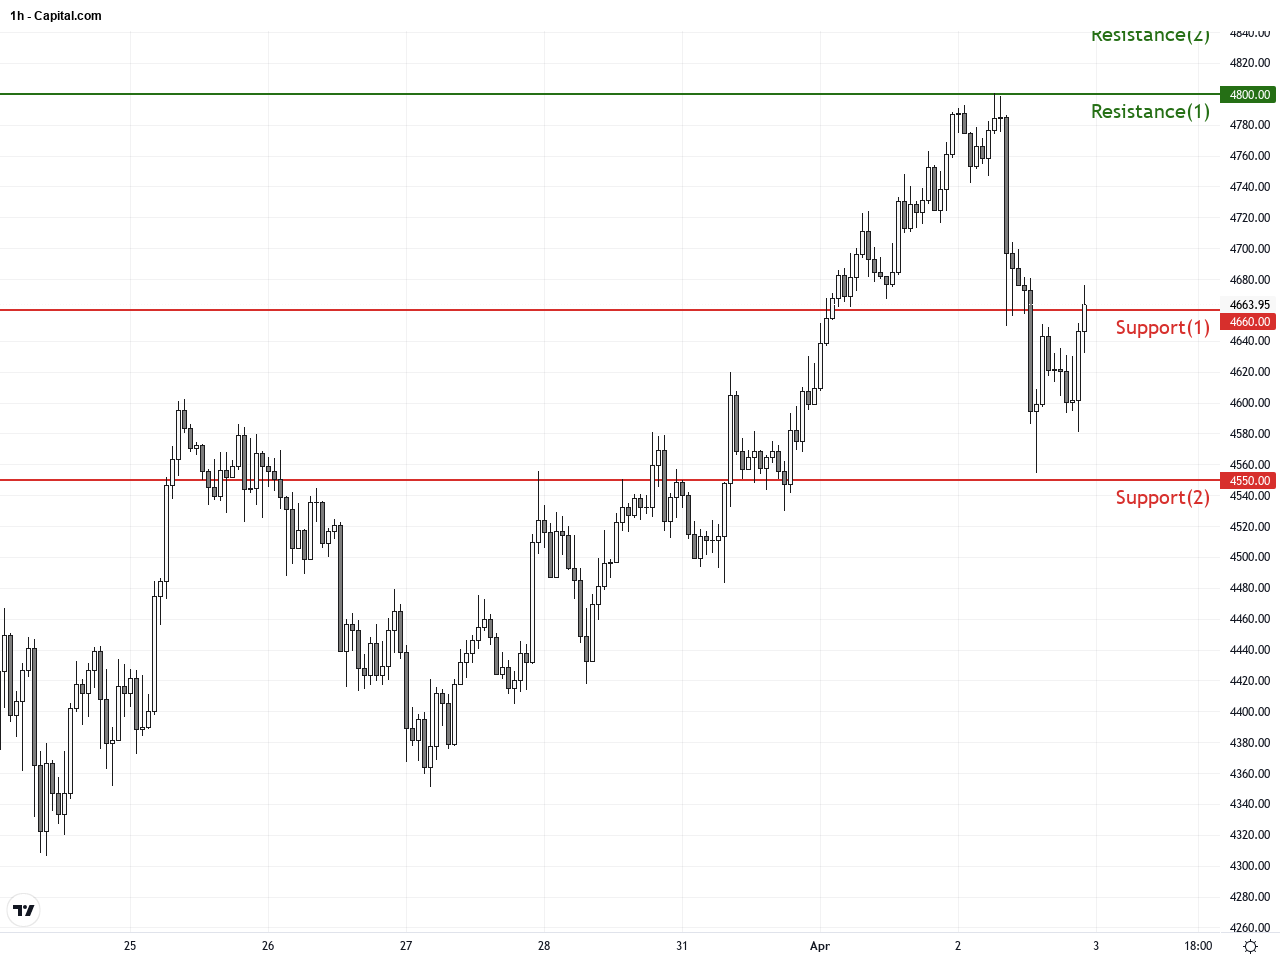
The hourly chart reveals increased volatility over the last 3-5 days as XAUUSD tested the $4800 resistance multiple times and retraced, oscillating between $4550 and $4700. Bollinger Bands widen showing increased volatility. MACD has recently crossed downward, indicating short-term selling pressure. The RSI dipping below 50 further confirms uncertainty, so traders should watch key support levels closely for the next price direction.
Technical Trend: The current trend is cautiously consolidative with bullish undertones, reflecting a moderate sideways wave within an overall uptrend.
Technically, XAUUSD has established solid mid-term support near $4660. Holding above $4725 on the daily chart signals clear bullish momentum. However, the short-term MACD downward crossover on hourly timeframe signals increased short-term selling pressure, indicating a possible pullback to test support. The market is currently in a multi-timeframe tug of war; a breakout above $4800 resistance on daily charts could trigger the next leg of the bullish run.Today’s economic calendar features Australian Trade Balance and China’s CPI releases at 02:30 and 08:30 GMT+1 respectively, both unlikely to directly impact XAUUSD which trades in USD. US trade balance data, weekly jobless claims, and Fed officials’ speeches in the afternoon may influence the USD and thus gold prices indirectly. Overall, no major direct economic events today are expected to cause significant moves in XAUUSD, though Fed commentary remains a critical focus for short-term traders.
Resistance & Support
The above financial market data, quotes, charts, statistics, exchange rates, news, research, analysis, buy or sell ratings, financial education, and other information are for reference only. Before making any trades based on this information, you should consult independent professional advice to verify pricing data or obtain more detailed market information. 1uptick.com should not be regarded as soliciting any subscriber or visitor to execute any trade. You are solely responsible for all of your own trading decisions.