 |
| Gold V.1.3.1 signal Telegram Channel (English) |

AUDUSD: AUD/USD Extends Gains Amid US-Iran Ceasefire, Eyes Key Resistance Levels
2026-04-10 @ 06:01
Over the past 48 hours, the AUD/USD pair exhibited mild volatility, closing yesterday around 0.7081, continuing its recent upward momentum. Latest market news highlights that hopes for a US-Iran ceasefire have kept the US dollar under pressure, which has been a key driver pushing the Australian dollar higher. Investor sentiment improved as demand for the safe-haven dollar softened, benefiting the AUD.
However, despite the recent gains, strategists warn that the rally may be overdone and the pair might enter a consolidation phase. The uncertainty around the ceasefire adds potential volatility ahead. For average investors, this means while the AUD/USD appears stable and bullish, ongoing geopolitical risks and shifts in US interest rate expectations still warrant close attention, as the market remains vulnerable to short-term swings.
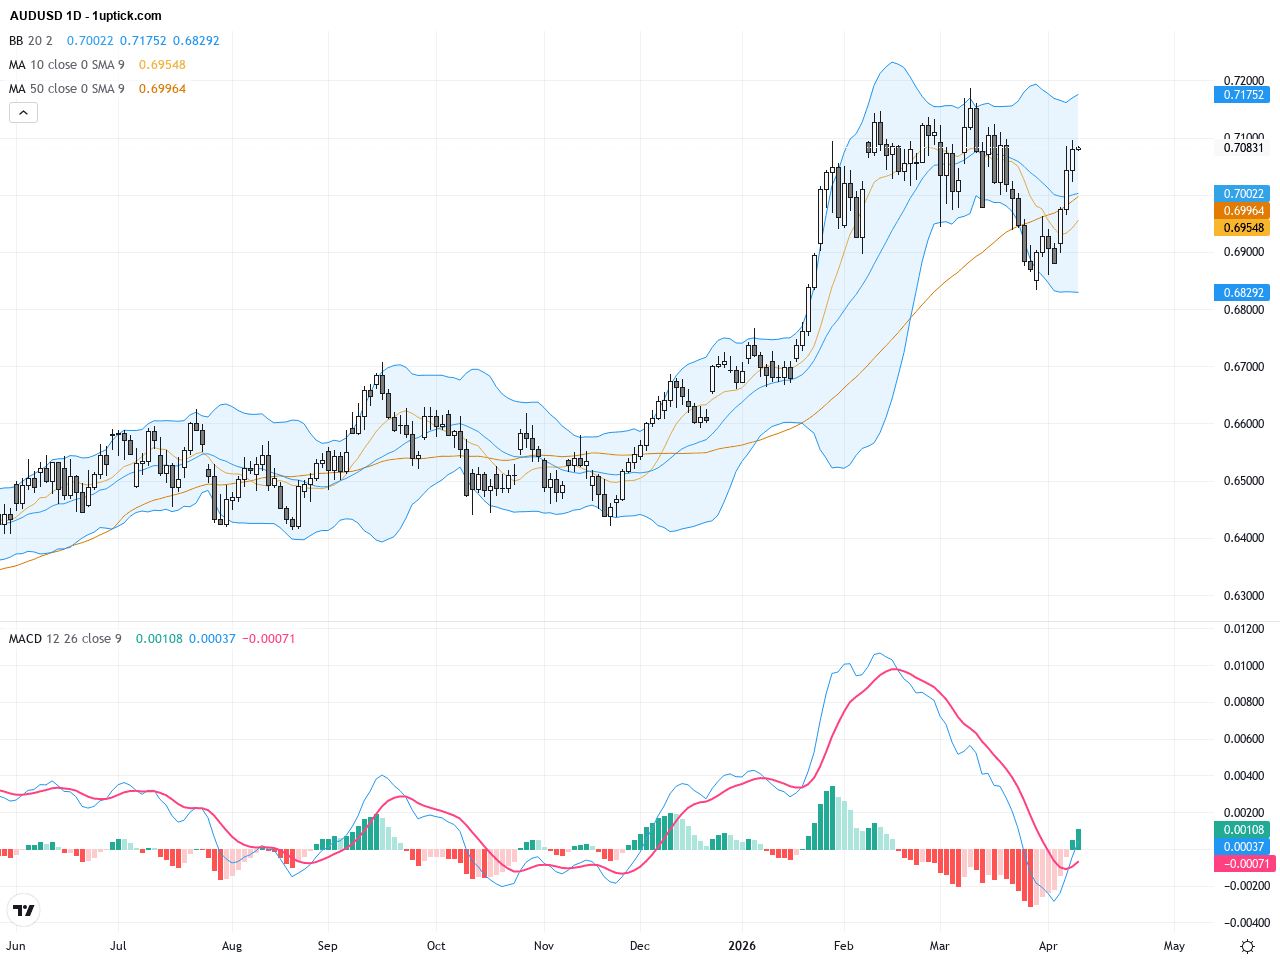
The daily chart depicts a robust rebound from recent lows, with AUDUSD moving up but stalling near the 0.7100 resistance. The 50-day moving average at around 0.70226 provides key support, while the 200-day SMA at 0.67239 confirms a long-term bullish structure. The MACD is recently in a bullish crossover phase, and Bollinger Bands are expanding, indicating increasing volatility with upward momentum. The overall trend is bullish, awaiting a clear break above 0.7100 to confirm further gains.
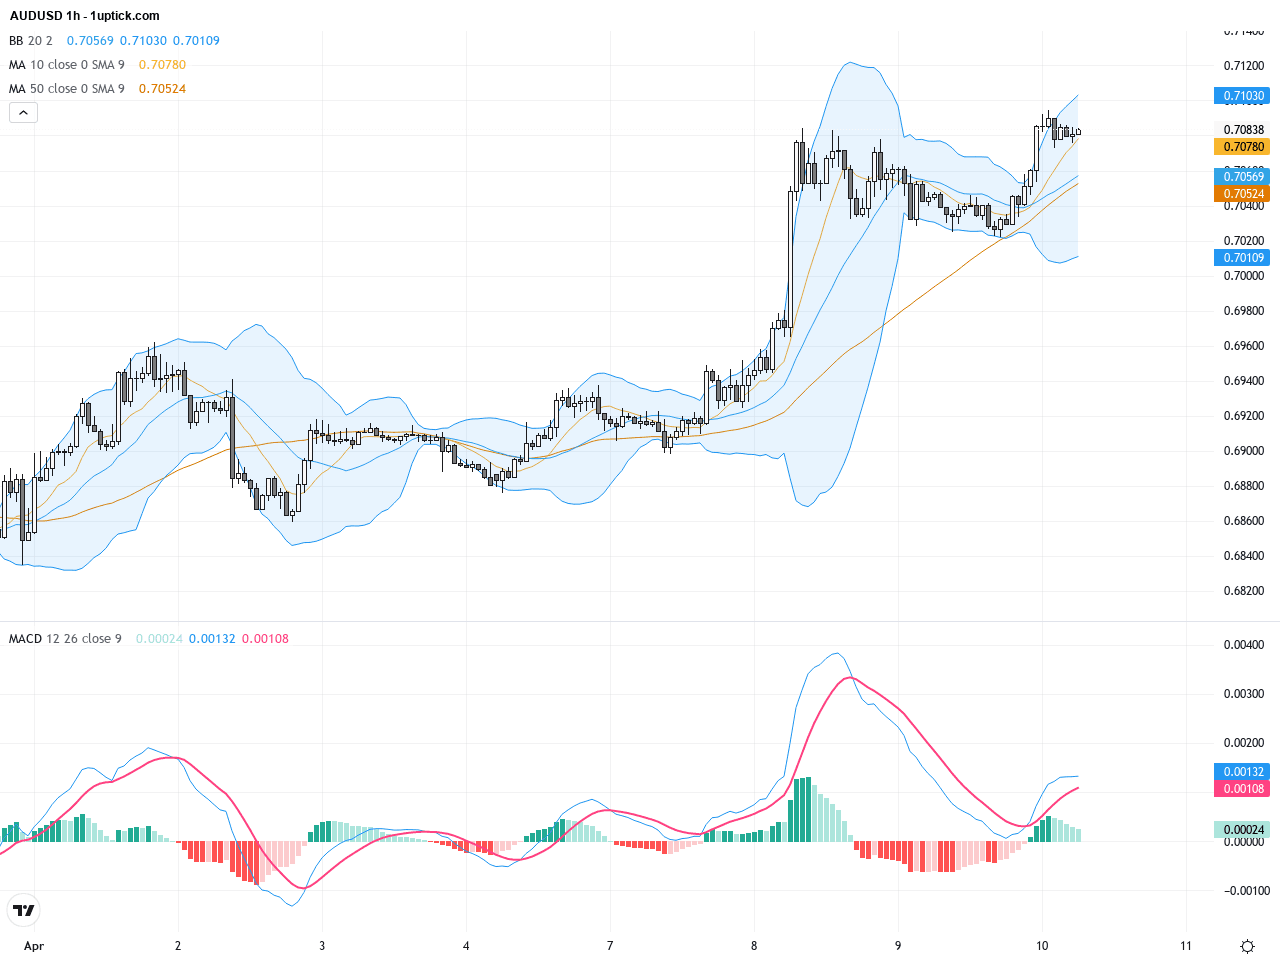
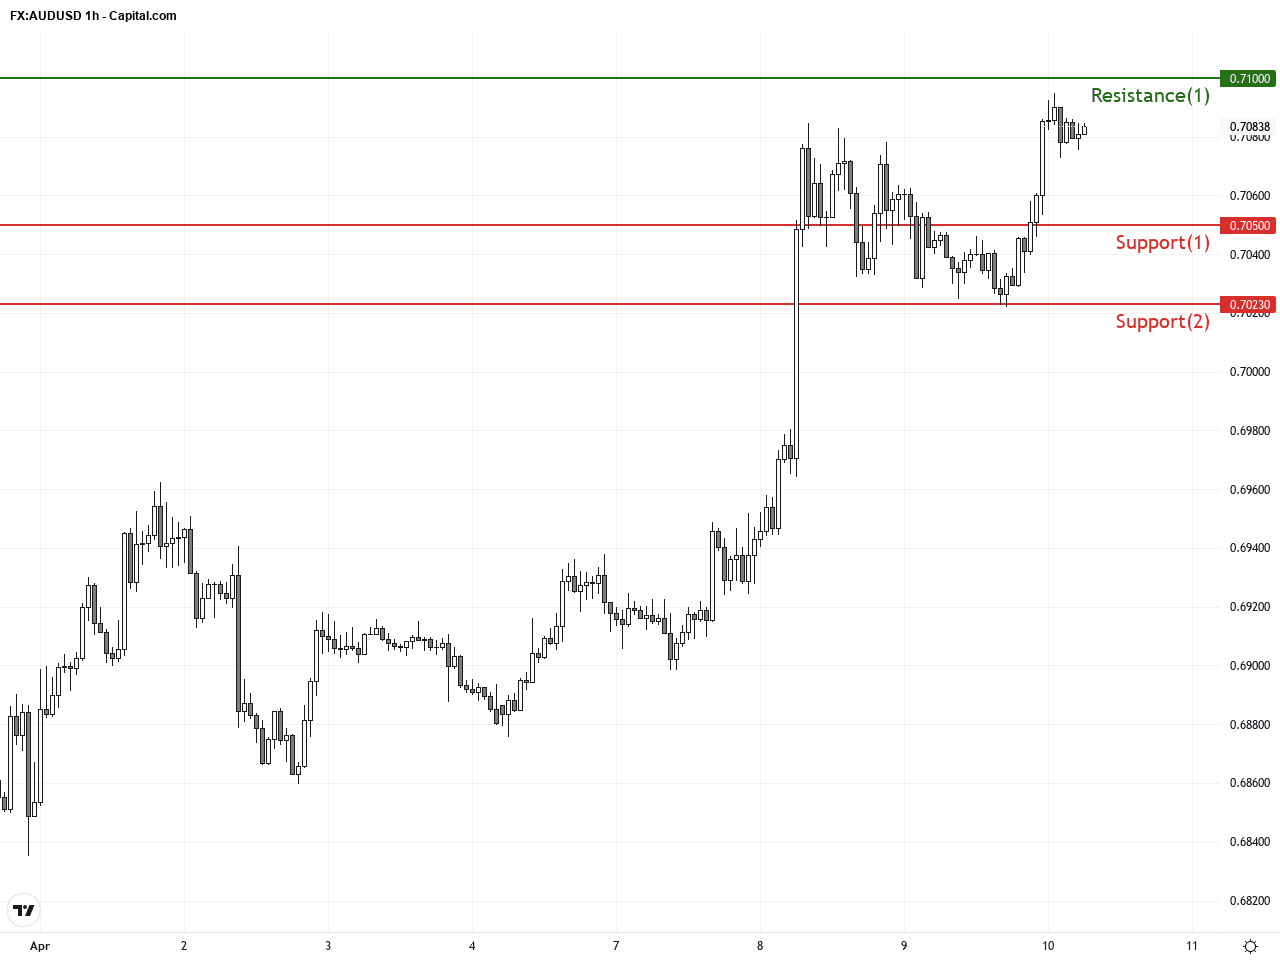
On the hourly chart over the past 3-5 days, AUDUSD has been consolidating between 0.7040 and 0.7090, forming a range-bound pattern. Short-term moving averages are intertwined, and the MACD is near the zero line, indicating lack of strong momentum. A recent bullish engulfing candle suggests a short-term rebound potential. Currently, the price action leans toward consolidation, waiting for a breakout to set the next directional bias.
Technical Trend: Cautiously Bullish with Consolidation
Technically, AUDUSD is supported by a weakening USD amid easing geopolitical tensions, sustaining a bullish posture. However, resistance near 0.7100 remains a barrier for further upside. The recent MACD bullish crossover needs volume confirmation for sustained continuation. The bullish engulfing candlestick formed in the last 24 hours signals near-term bullishness. Traders should watch key US data releases and geopolitical developments as these will likely determine the next leg of price movement.Today’s economic calendar does not present any directly significant events for AUDUSD, but the upcoming US Consumer Price Index (CPI) data release at 14:30 GMT+1 is crucial. A higher-than-expected CPI could strengthen the USD and weigh on AUDUSD, while a softer print might support the AUD. Additionally, China’s CPI and PPI figures released earlier may indirectly influence market risk sentiment, which can affect the pair.
Resistance & Support
The above financial market data, quotes, charts, statistics, exchange rates, news, research, analysis, buy or sell ratings, financial education, and other information are for reference only. Before making any trades based on this information, you should consult independent professional advice to verify pricing data or obtain more detailed market information. 1uptick.com should not be regarded as soliciting any subscriber or visitor to execute any trade. You are solely responsible for all of your own trading decisions.