


 |
| Gold V.1.3.1 signal Telegram Channel (English) |

AUDUSD Surges Past 0.7100: Key Technical Resistance at 0.7155 in Focus
2026-04-15 @ 06:01
Over the past 24 to 48 hours, the Australian Dollar against the US Dollar (AUD/USD) exhibited a solid upward trend, with yesterday’s closing price at 0.7124, marking a notable increase from the previous day. This rally was primarily driven by easing risk aversion and a reduction in geopolitical tensions, particularly optimism surrounding potential new US-Iran peace talks, which buoyed demand for the Australian Dollar.
Robust economic data from Australia also bolstered confidence in the currency. Despite recent pressures from the Strait of Hormuz tensions and a recalibration of Fed easing expectations, the AUD showed resilience, reflecting growing investor attention to Australia’s strong economic fundamentals and its appeal as a commodity currency. Overall, AUD/USD surpassed the 0.71 level amid this positive momentum, injecting optimism into the market.
For the average investor, this upward move illustrates how a sudden easing in geopolitical concerns can quickly attract capital inflows into the AUD, creating a short-term boost in risk appetite. In other words, as hopes for peace talks brighten market sentiment, the Australian Dollar emerges as a favored target for investors seeking both yield and stability.

The daily chart reveals a steady uptrend for AUDUSD starting from the year’s low near 0.63218. The pair has reclaimed and held above the 21-day Exponential Moving Average (EMA), which is acting as dynamic support. The recent sharp bounce originated around 0.6979 and pushed the price above 0.7100, maintaining trading within a 0.7120 area. Bollinger Bands show contraction, hinting at potential consolidation. The MACD indicator spreads positively, confirming sustained bullish momentum. The immediate resistance at 0.7155 remains a key technical hurdle.
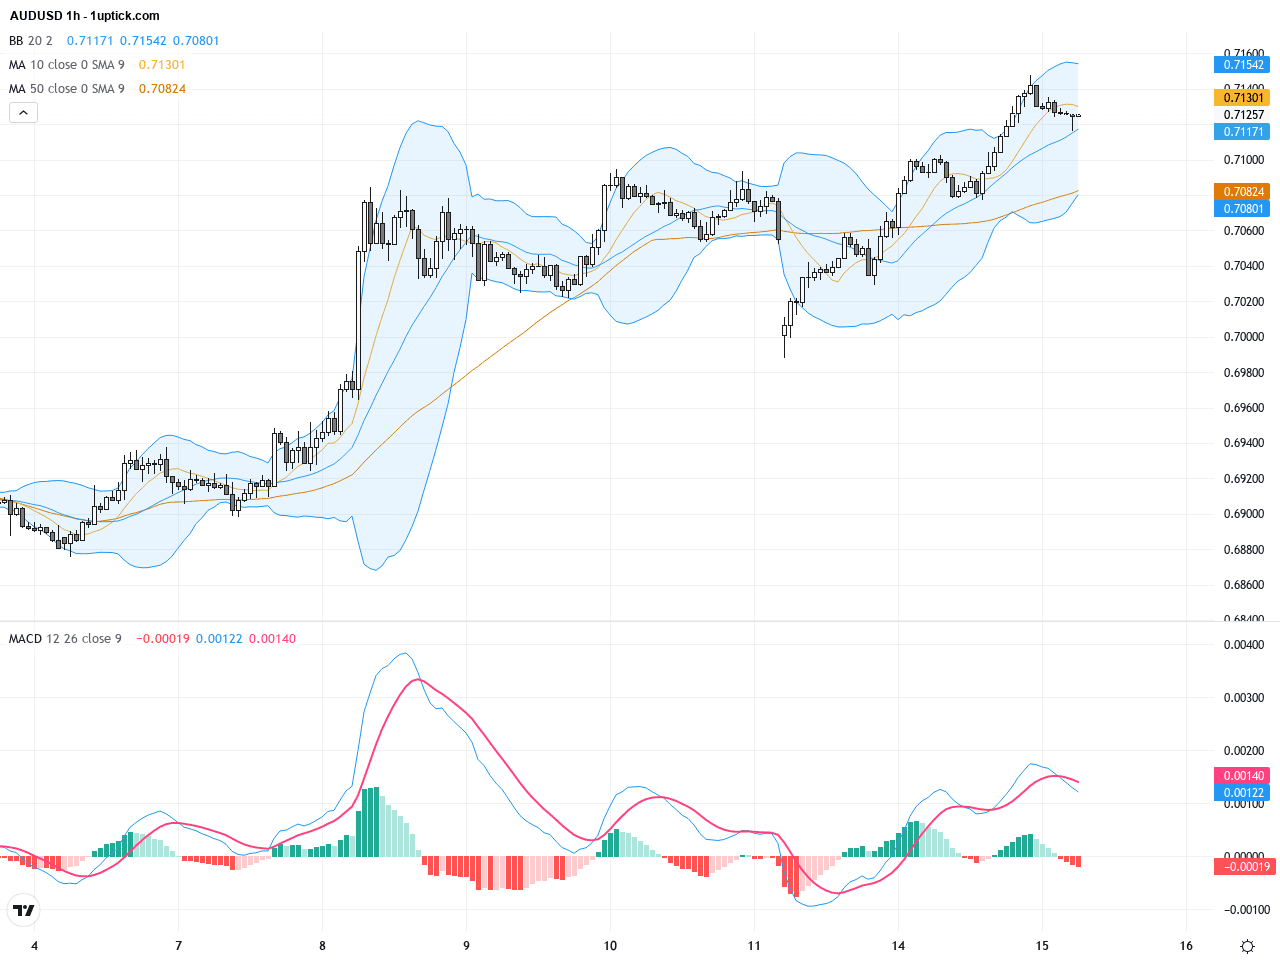
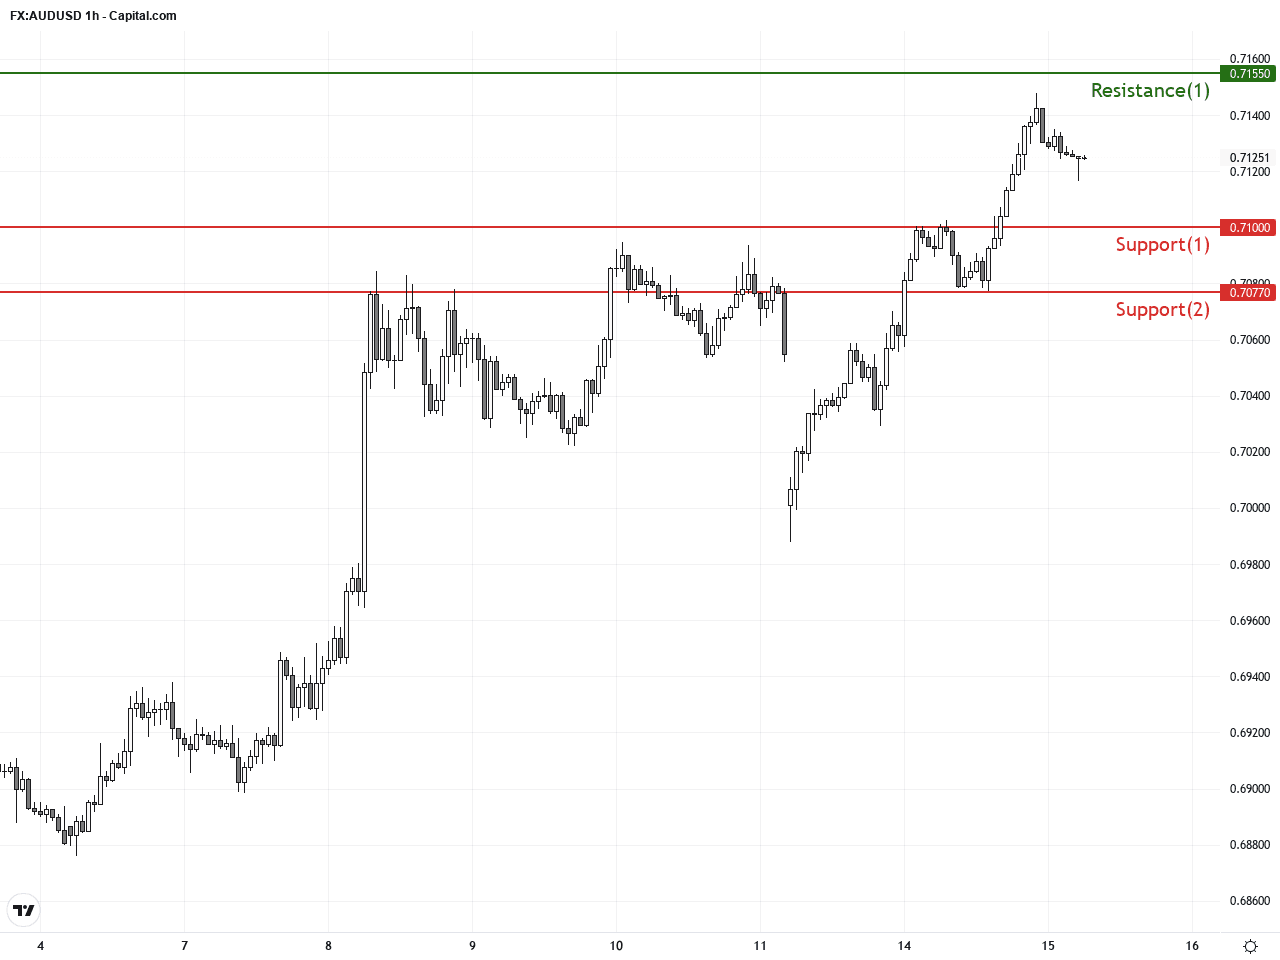
On the hourly chart covering the last 3-5 days, AUDUSD shows a robust rebound with multiple reinforced support levels along the way. Price climbed steadily from about 0.7005 and interacts closely with the 21EMA, reflecting active short-term buying pressure. A recent MACD golden cross and RSI reading above 60 support ongoing upward momentum. A forming symmetrical triangle pattern could trigger a breakout on either side, but a break above 0.7155 would likely accelerate bullish momentum.
Technical Trend: The current trend is a solid uptrend with cautious consolidation, best described as “Cautiously Bullish.” Short-term price action expects some sideways moves before a possible continuation upward.
From a technical perspective, AUDUSD is currently in a corrective bullish phase. The daily 21-EMA serves as solid support, while the MACD histogram widening alongside Bollinger Band contraction suggests a temporary consolidation phase. The hourly chart reveals a symmetrical triangle pattern accompanied by a MACD golden cross and RSI bullish bias, indicating short-term buying opportunity. The recent bullish engulfing candle reflects renewed buyer strength over the next 24 hours. Watching the 0.7155 resistance closely will determine if the uptrend can sustain momentum.Today’s economic calendar offers no direct major releases impacting AUDUSD. Australia’s data is limited to conference minutes without forecasts or expected surprises. However, afternoon US data releases at 14:30 GMT+1 (21:30 HKT) including multiple price indices and manufacturing reports could influence USD strength. Strong US data may bolster the dollar, pressuring AUDUSD lower; weaker figures would support the Aussie. Traders should monitor these releases closely for potential market moves.
Resistance & Support
The above financial market data, quotes, charts, statistics, exchange rates, news, research, analysis, buy or sell ratings, financial education, and other information are for reference only. Before making any trades based on this information, you should consult independent professional advice to verify pricing data or obtain more detailed market information. 1uptick.com should not be regarded as soliciting any subscriber or visitor to execute any trade. You are solely responsible for all of your own trading decisions.