 |
| Gold V.1.3.1 signal Telegram Channel (English) |
How to Develop Multi-Factor Technical Analysis Entry and Exit Strategies for Bitcoin and Crypto-Linked Forex Pairs Amid Regulatory Shifts and Equity Market Spillovers
2026-04-19 @ 00:05
Developing Multi-Factor Technical Analysis Strategies for Crypto-Forex Trading
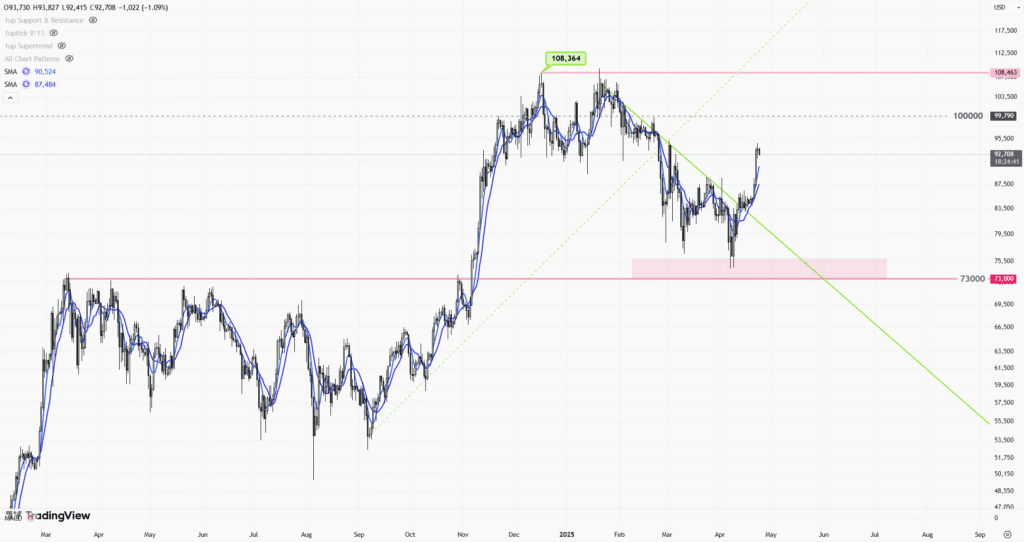
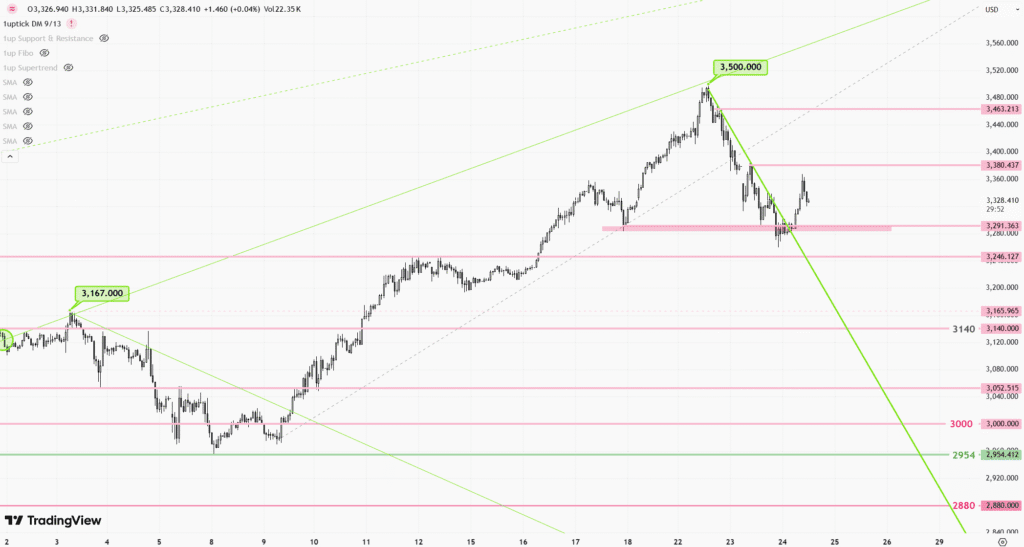
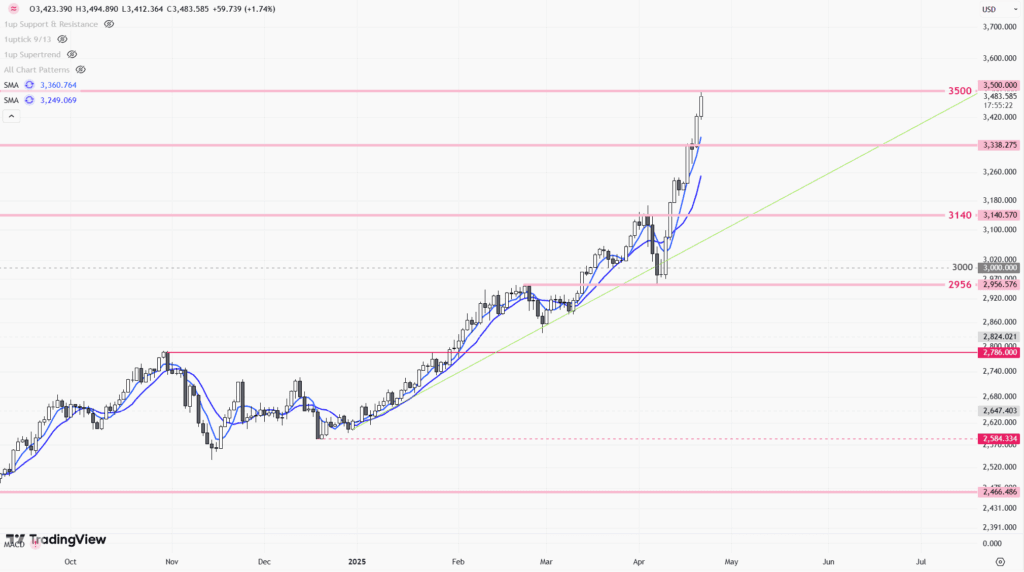
In today’s interconnected financial landscape, Bitcoin and crypto-linked forex pairs such as BTC/USD, ETH/USD, and crypto-correlated currencies like AUD/USD and USD/KRW present unique opportunities and challenges. This comprehensive guide provides institutional-grade methodologies for constructing multi-factor entry and exit strategies that account for regulatory dynamics and equity market correlations.
step_num: 1, heading: Establish Your Multi-Factor Framework Foundation, content: Begin by identifying 3-5 complementary technical indicators across different analytical categories. Combine trend-following indicators (200-day EMA, Ichimoku Cloud), momentum oscillators (RSI with 14-period setting, Stochastic RSI), volume-based metrics (OBV, Volume Profile), and volatility measures (Bollinger Bands, ATR). For crypto-forex pairs, incorporate the Bitcoin Dominance Index and crypto fear-and-greed indices as supplementary sentiment factors. Weight each factor based on current market regime—prioritize trend indicators during directional phases and mean-reversion tools during consolidation.
step_num: 2, heading: Map Cross-Asset Correlation Matrices, content: Construct a dynamic correlation dashboard tracking relationships between Bitcoin, major equity indices (S&P 500, NASDAQ), the VIX, and your target forex pairs. During risk-off episodes, BTC often correlates above 0.7 with tech-heavy indices. Monitor 30-day rolling correlations and establish threshold alerts when correlations exceed historical norms. When equity market spillovers intensify, reduce position sizes by 25-40% and widen stop-loss parameters. Use tools like TradingView’s correlation coefficient indicator or build custom spreadsheets linking API data from multiple exchanges.
step_num: 3, heading: Integrate Regulatory Event Calendars and Sentiment Tracking, content: Create a comprehensive regulatory monitoring system covering SEC announcements, CFTC positions, EU MiCA implementation updates, and Asian regulatory developments from jurisdictions like Hong Kong, Singapore, and Japan. Subscribe to official government feeds and reputable crypto-legal newsletters. Assign risk scores (1-5) to upcoming regulatory events and reduce exposure 48-72 hours before high-impact announcements. Track on-chain metrics such as exchange inflows/outflows as early warning signals of institutional repositioning ahead of regulatory news.
step_num: 4, heading: Design Entry Signal Confluence Requirements, content: Establish strict confluence rules requiring minimum 3 out of 5 factors to align before entry. Example entry criteria: Price above 50-EMA AND RSI between 40-60 (not overbought) AND positive OBV divergence AND Bitcoin dominance stable/rising AND no major regulatory events within 5 trading days. For crypto-forex pairs like AUD/USD during Bitcoin rallies, confirm the risk-on environment through copper prices and Chinese equity performance. Document all entry rules in a systematic checklist to eliminate emotional decision-making.
step_num: 5, heading: Construct Dynamic Exit and Risk Management Protocols, content: Implement tiered exit strategies with profit targets at 1.5R, 2.5R, and 3.5R (where R = initial risk). Use ATR-based trailing stops calibrated to crypto’s higher volatility—typically 2.5-3x ATR for Bitcoin pairs versus 1.5x ATR for traditional forex. Create hard exit triggers for regulatory black swan events: immediate 50% position reduction upon major adverse regulatory announcements, with full exit if price breaches key support. Incorporate time-based exits—close positions that haven’t reached first profit target within 10 trading sessions to free capital for higher-probability setups.
step_num: 6, heading: Backtest and Stress-Test Across Market Regimes, content: Validate your strategy across minimum 3 years of historical data encompassing bull markets (2020-2021), bear markets (2022), and recovery phases (2023-2024). Specifically stress-test performance during events like the Terra/Luna collapse, FTX bankruptcy, and major Fed rate decisions. Calculate key metrics: Sharpe ratio (target >1.5), maximum drawdown (limit to <20%), win rate, and profit factor. Use platforms like QuantConnect, Backtrader, or MT5's strategy tester. If backtested results show >30% performance degradation during regulatory crisis periods, add additional filters or reduce base position sizing.
step_num: 7, heading: Implement Real-Time Monitoring and Adaptive Optimization, content: Deploy automated alert systems through TradingView, custom Python scripts, or institutional platforms like Bloomberg Terminal for real-time signal monitoring. Review strategy performance weekly, calculating rolling 30-day metrics against benchmarks. Conduct monthly factor contribution analysis to identify which indicators are adding alpha versus creating noise. Quarterly, reassess correlation assumptions and regulatory risk weightings. Maintain a detailed trading journal documenting market conditions, signal quality, and execution notes for continuous improvement.
Insider Insight: Experienced practitioners recognize that during periods of heightened regulatory uncertainty—such as the current SEC enforcement cycle against major exchanges—multi-factor strategies should temporarily overweight on-chain metrics and underweight pure price-based technical signals. Smart money movements visible through whale wallet tracking and stablecoin flow analysis often front-run price action by 12-48 hours. Additionally, the strongest crypto-forex setups occur when Bitcoin technicals align with macro forex flows; for instance, a bullish BTC breakout combined with broad USD weakness against commodity currencies creates high-conviction AUD/USD and NZD/USD long opportunities with favorable risk-reward profiles exceeding 3:1.