









 |
| Gold V.1.3.1 signal Telegram Channel (English) |
XAUUSD: Gold Faces Critical Test Amid Fed Rate Signals and Oil-Driven Inflation Pressure
2026-04-28 @ 05:04
Over the past 24 to 48 hours, gold prices (XAUUSD) have exhibited notable volatility, influenced by a confluence of key factors. The closing price yesterday stood at 4679.92 USD, marking a retreat from recent highs as markets grapple with growing uncertainty over the Federal Reserve’s interest rate outlook and persistent inflation pressures.
Recent reports highlight that soaring oil prices are boosting inflation concerns, prompting markets to reassess expectations for interest rates to remain higher for longer. This shift disrupts the earlier 2026 consensus which had anticipated rate cuts, impacting gold’s appeal as an inflation hedge and driving prices lower in the short term.
For retail and active investors, this means gold’s traditional safe-haven role is facing challenges amid evolving macroeconomic conditions. With three major central banks poised to announce decisions soon, gold’s price direction will hinge critically on the cues they provide. Given ongoing geopolitical tensions and energy price volatility, it is crucial to stay alert to market news and central bank communications to manage risk effectively.
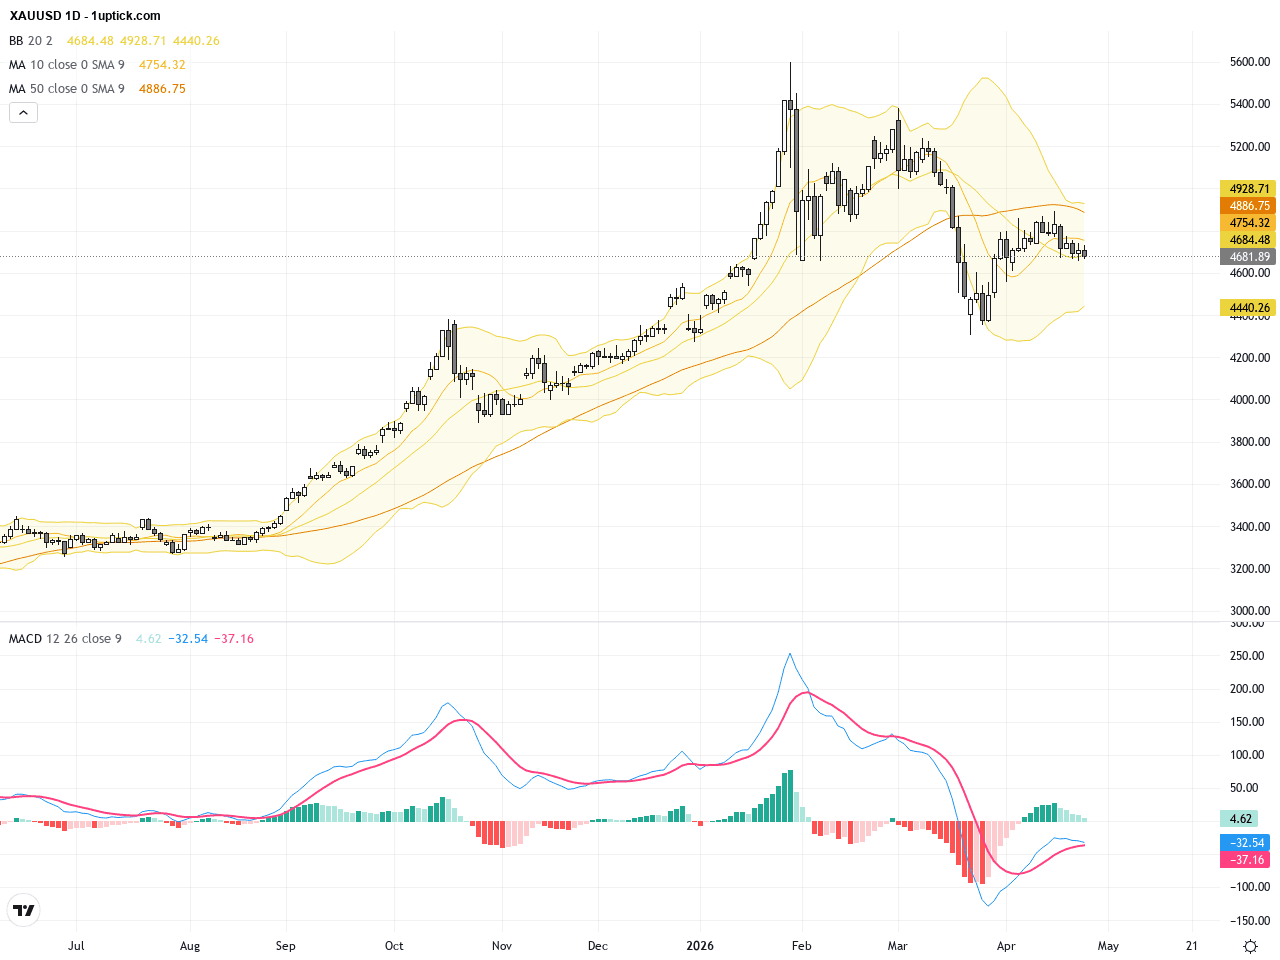
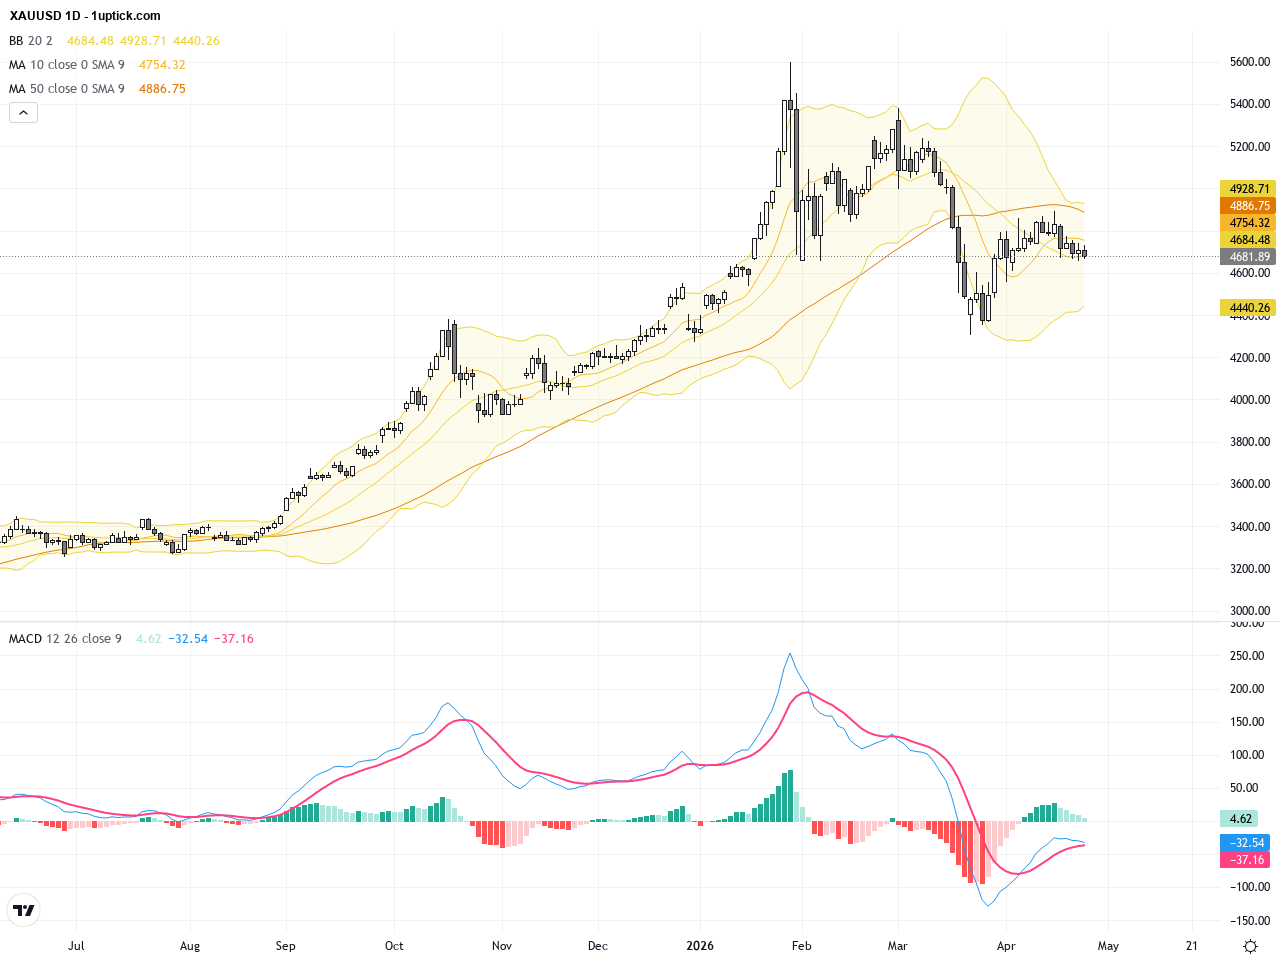
The daily chart reveals a clear downtrend from mid-April’s high near $4840. XAUUSD repeatedly failed to break the significant resistance at $4740, forming a pattern of lower highs. The Bollinger Bands are contracting, indicating decreased volatility, while the MACD remains below the zero line without showing reversal signs, confirming ongoing bearish momentum. Overall, the longer-term daily structure shows XAUUSD in a corrective phase pressured by high rates anticipation and global economic uncertainties, lacking robust upside momentum recently.
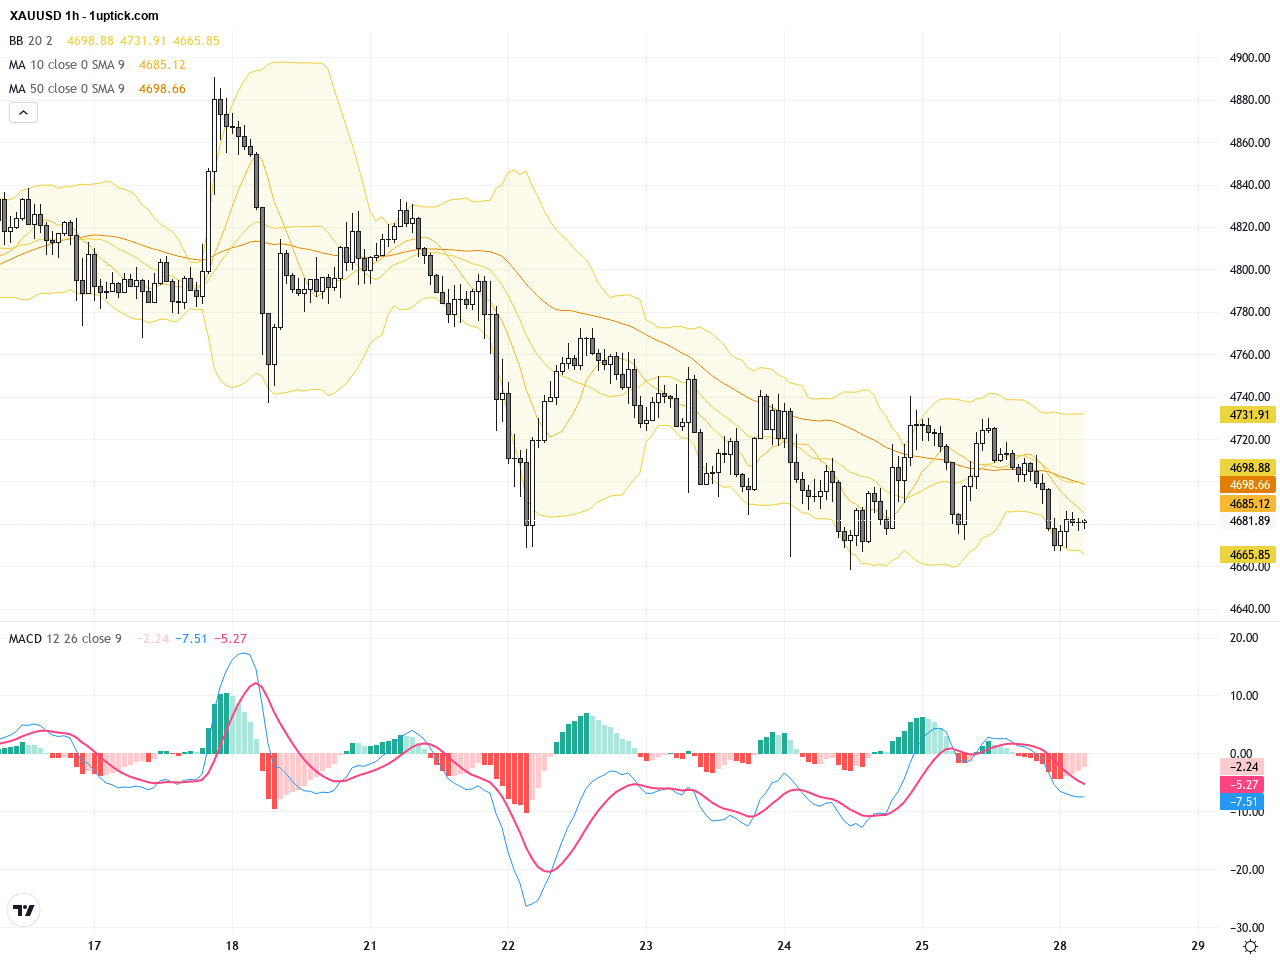
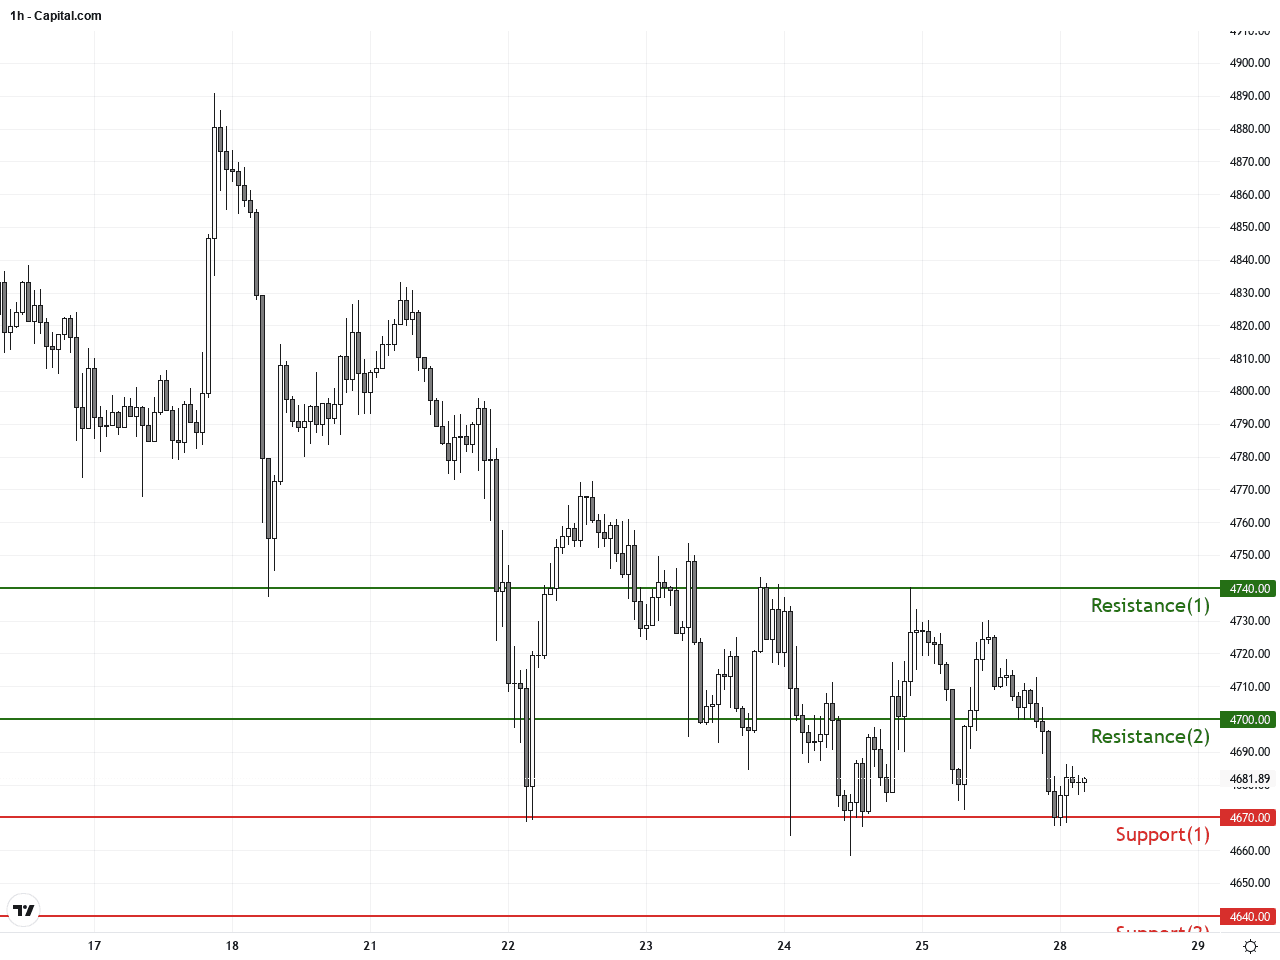
Looking at the hourly chart for the past 3-5 days, XAUUSD is trading within a descending channel, consistently below the 20-period moving average. The MACD shows a short-term bullish divergence, hinting at a potential rebound. Recently formed candlestick patterns, including hammer candles with long lower wicks, suggest that selling pressure has eased somewhat, possibly signaling an early relief rally. However, resistance near $4700 remains a critical hurdle for the bulls to overcome in the coming sessions.
Technical Trend: Short-term consolidation with bearish bias.
Technically, the combined daily and hourly analysis indicates XAUUSD is in a cautious downward correction, with the MACD confirming bearish dominance on the daily scale but showing a short-term bullish divergence on the hourly chart. The presence of hammer candlesticks points to a possible short-term bounce, yet the key resistance zone around $4700 remains a significant battleground. The tightening Bollinger Bands suggest increased volatility soon, advising traders to maintain cautious entry points.There are no significant or directly relevant economic events today affecting XAUUSD. Although Germany’s GfK Consumer Confidence and UK’s CBI Realized Sales data release with moderate importance, and the US Dallas Fed Manufacturing Index is being reported, none are expected to move gold prices materially. Thus, XAUUSD’s near-term moves will mostly hinge on the market’s interpretation of Fed policies and oil price dynamics.
Resistance & Support
The above financial market data, quotes, charts, statistics, exchange rates, news, research, analysis, buy or sell ratings, financial education, and other information are for reference only. Before making any trades based on this information, you should consult independent professional advice to verify pricing data or obtain more detailed market information. 1uptick.com should not be regarded as soliciting any subscriber or visitor to execute any trade. You are solely responsible for all of your own trading decisions.