









 |
| Gold V.1.3.1 signal Telegram Channel (English) |
GBPUSD: Key Technical Patterns and Support Levels Signal Imminent Breakout, August 7, 2026
2026-08-07 @ 13:01
Over the past 24 to 48 hours, GBP/USD experienced notable volatility, with the pound coming under selling pressure as demand for the U.S. dollar strengthened. The pair slipped slightly from yesterday’s close of 1.34538. Ahead of the upcoming U.S. June Non-Farm Payrolls report, the market’s anticipation boosted the dollar’s safe-haven status, weighing on the pound. However, softer U.S. economic data and easing geopolitical tensions briefly supported GBP/USD midweek before the dollar regained momentum approaching the payrolls release.
For the average investor, this means the pound’s recent performance remains highly dependent on dollar dynamics and U.S. employment data. The Non-Farm Payrolls report is a critical indicator of U.S. economic health, often causing sudden moves in the dollar and by extension GBP/USD. Traders and investors alike are closely watching this data, resulting in increased market fluctuations and an urgent need to monitor shifts in dollar strength for short-term trading or longer-term positioning.
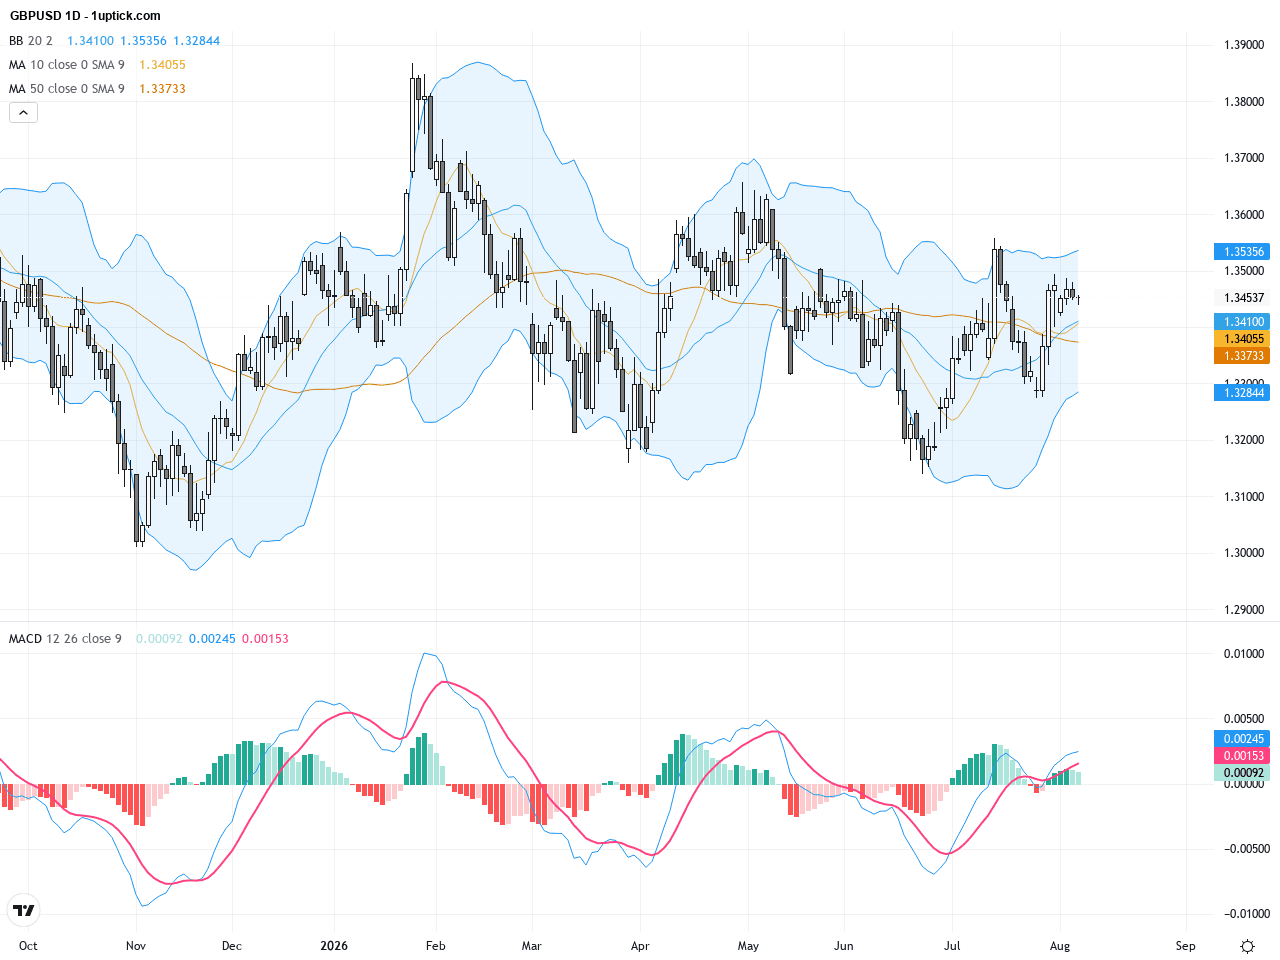
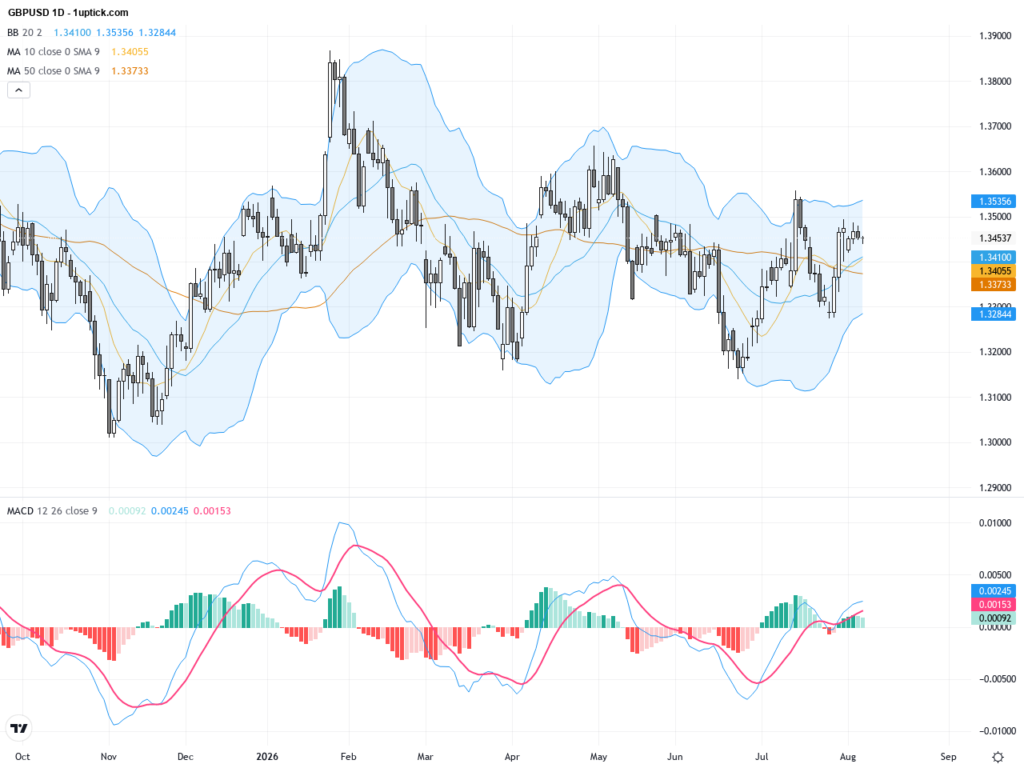
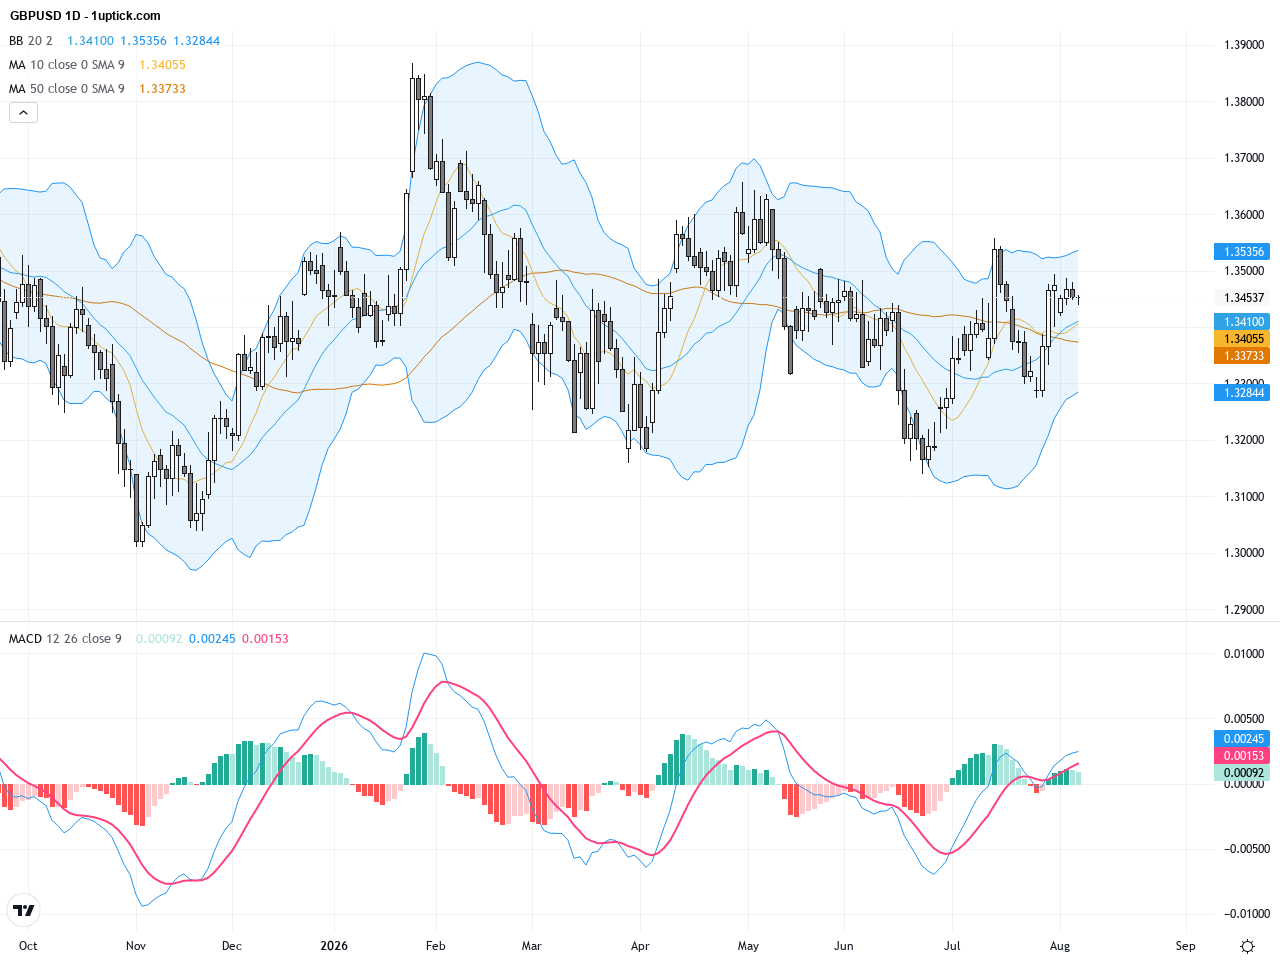
The daily chart reveals GBPUSD’s gradual rebound from early-year lows near 1.21, progressing in a mild uptrend. Recently, the price has been consolidating around 1.34, hovering near the 20-day moving average. The Bollinger Bands are narrowing, signaling reduced volatility. The MACD is close to the zero line, with no clear bullish or bearish crossover, reflecting an unclear trend. Overall, the long-term trend leans mildly bullish, but short-term caution is warranted for potential pullbacks.
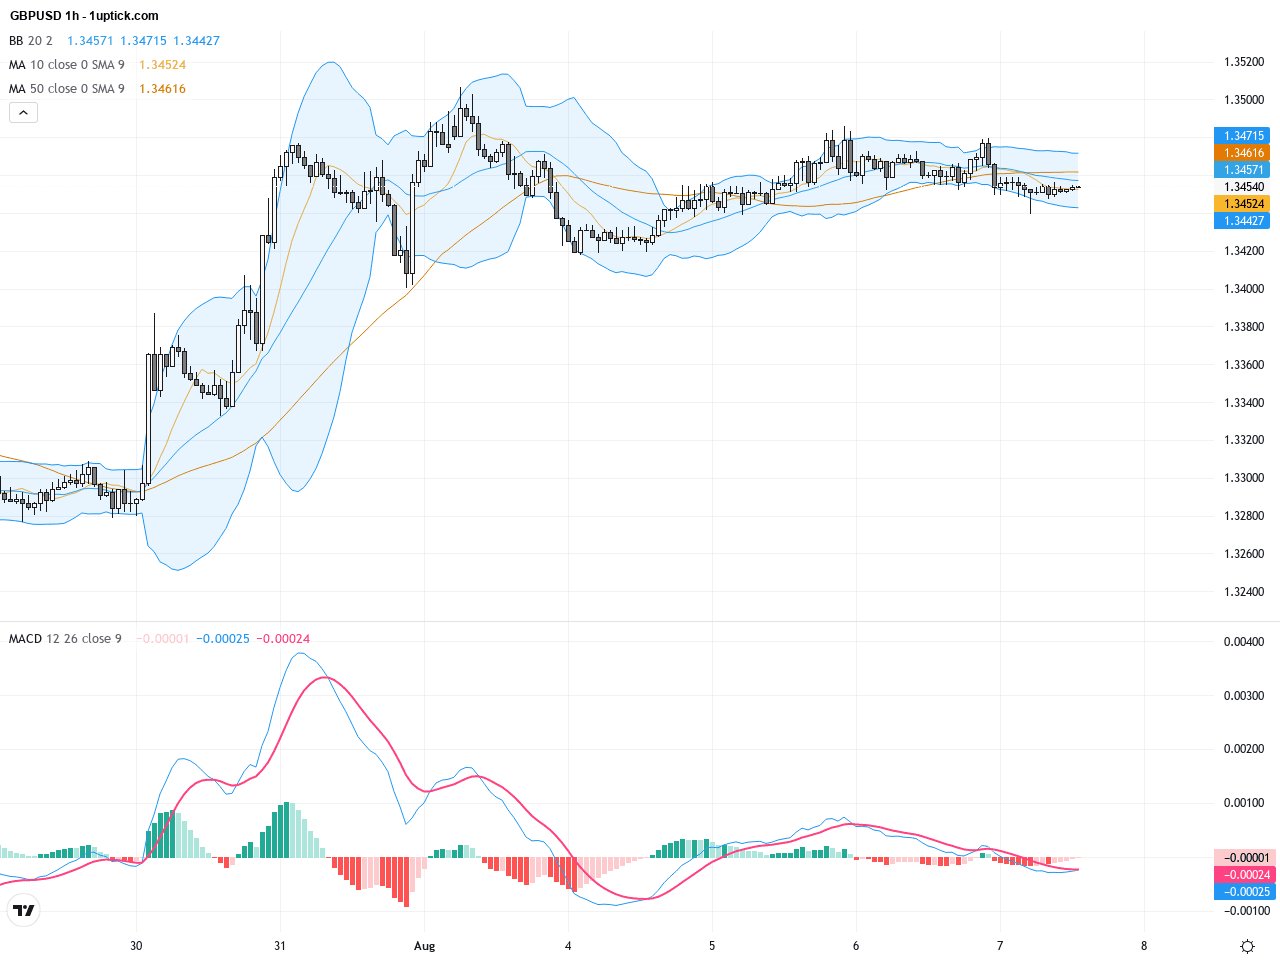
The hourly chart over the past 3-5 days shows GBPUSD oscillating between 1.34 and 1.35, repeatedly testing resistance around 1.345 without successful breakouts. The 20- and 50-period moving averages intersect near 1.344-1.346, indicating consolidation. The MACD suggests a mild bearish momentum, while the RSI remains above oversold levels, hinting at a possible short-term retracement before a breakout. Bollinger Bands have slightly widened, suggesting increasing volatility and the potential for a breakout soon.
Technical Trend: GBPUSD is currently in a cautiously sideways consolidation phase, awaiting the upcoming Non-Farm Payrolls data, with volatility expected to rise but no decisive trend established yet.
Technically, GBPUSD resides at a crucial juncture with support and resistance levels tightening. A consolidating triangle pattern on the daily chart points to an impending breakout. The recent bearish engulfing candlestick suggests selling pressure, but disappointed USD NFP data could trigger a sharp retracement. MACD and RSI momentum indicators are at pivotal points, making the next 24 hours critical for directional clarity and trade setup.Today’s economic calendar highlights the US Non-Farm Employment Change and Unemployment Rate scheduled at 14:30 GMT+1 (21:30 HKT), critical for GBPUSD movement. The forecast predicts 80K jobs added, up from 57K previously. A stronger-than-expected report would likely boost the US dollar, putting downward pressure on GBPUSD. Conversely, weaker results could support the pound. UK economic releases are light, concentrating risk on the US labor market data, which traders will watch closely.
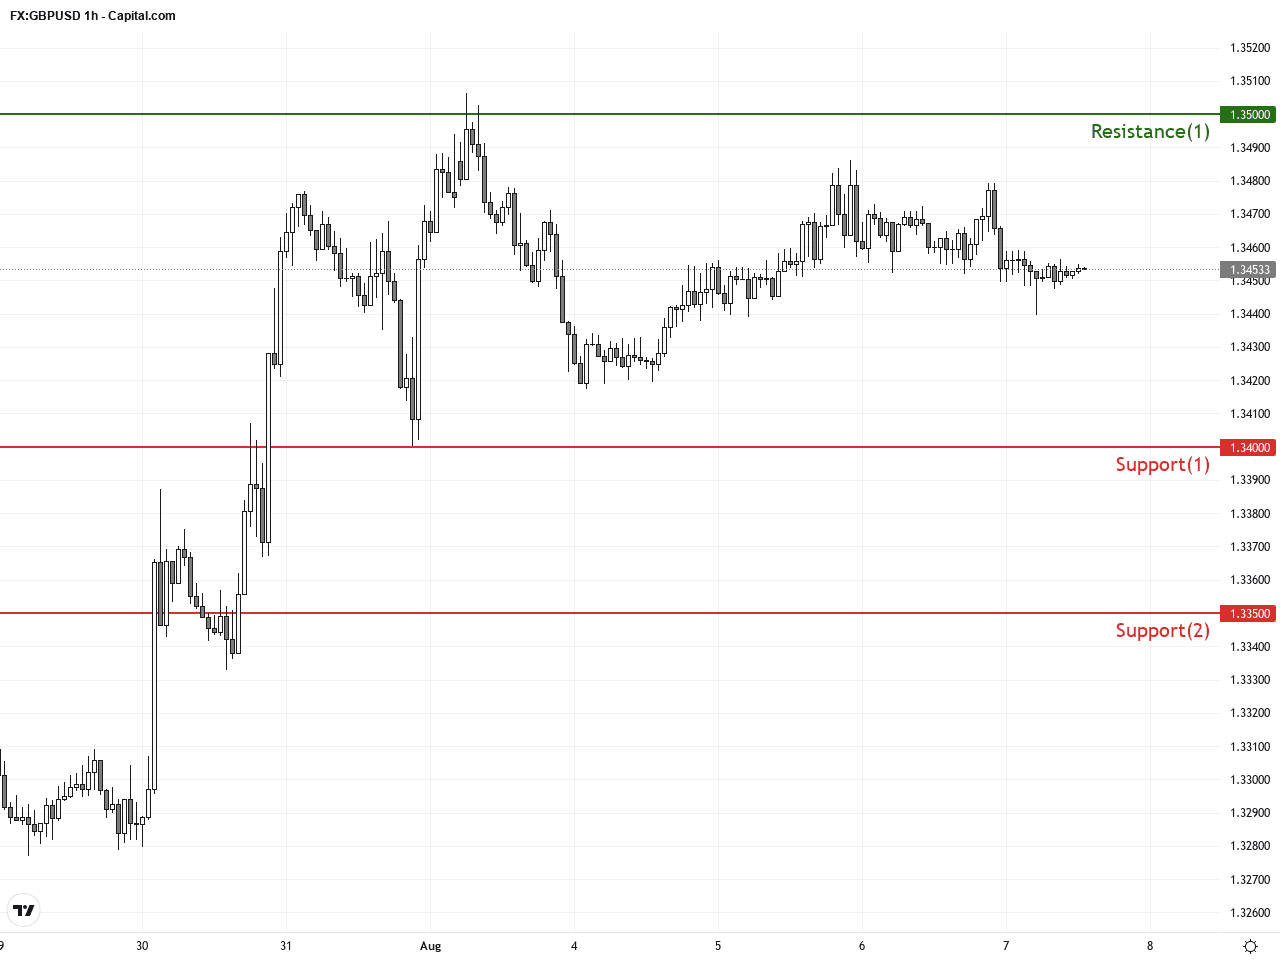
Resistance & Support
The above financial market data, quotes, charts, statistics, exchange rates, news, research, analysis, buy or sell ratings, financial education, and other information are for reference only. Before making any trades based on this information, you should consult independent professional advice to verify pricing data or obtain more detailed market information. 1uptick.com should not be regarded as soliciting any subscriber or visitor to execute any trade. You are solely responsible for all of your own trading decisions.