




 |
| Gold V.1.3.1 signal Telegram Channel (English) |

EURUSD: Bullish Breakout Signals Renewed Uptrend Momentum
2026-04-20 @ 09:01
In the past 24 to 48 hours, EUR/USD exhibited noticeable volatility, with yesterday’s closing price at 1.17545. The market was influenced by multiple factors, especially optimistic sentiments from Middle East ceasefire talks and the drag on EU growth due to trade tariffs.
According to the latest market news, optimism around a Middle East ceasefire eased oil price pressures, leading the US dollar to retreat from war-driven highs. This supported EUR/USD’s gradual rise towards a six-week peak. The thaw in US-Iran tensions boosted risk appetite and encouraged capital flows into riskier assets, significantly benefiting the euro against the dollar.
Nonetheless, the EU still faces growth challenges from increased trade tariffs, leaving Euro’s upward path uncertain. For average investors, this means the forex market currently navigates a complex web of geopolitical and economic factors. It’s wise to stay vigilant on global developments, especially how Middle East events continue to affect oil prices and the dollar’s performance.
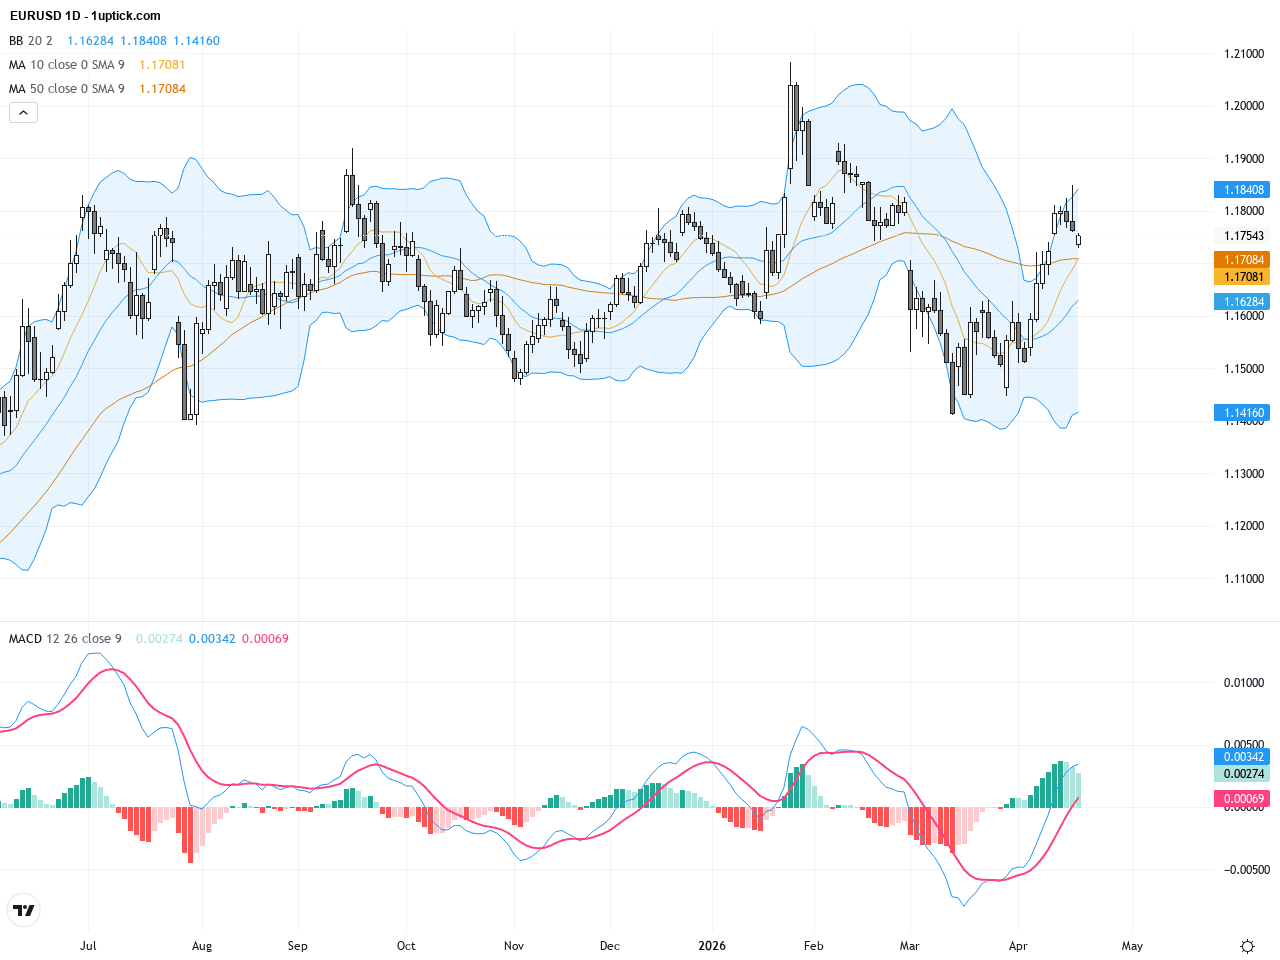
The daily chart illustrates a steady uptrend since late March, with EURUSD recently breaking above the 50-, 100-, and 200-day moving averages (MA), confirming a bullish alignment. The Bollinger Bands are widening, indicating increased volatility and sustained bullish control. The MACD remains above zero with the fast line over the slow line, reinforcing medium-to-long-term upward momentum. Overall, the daily timeframe signals a strong rebound trend with short-term bulls holding the upper hand.
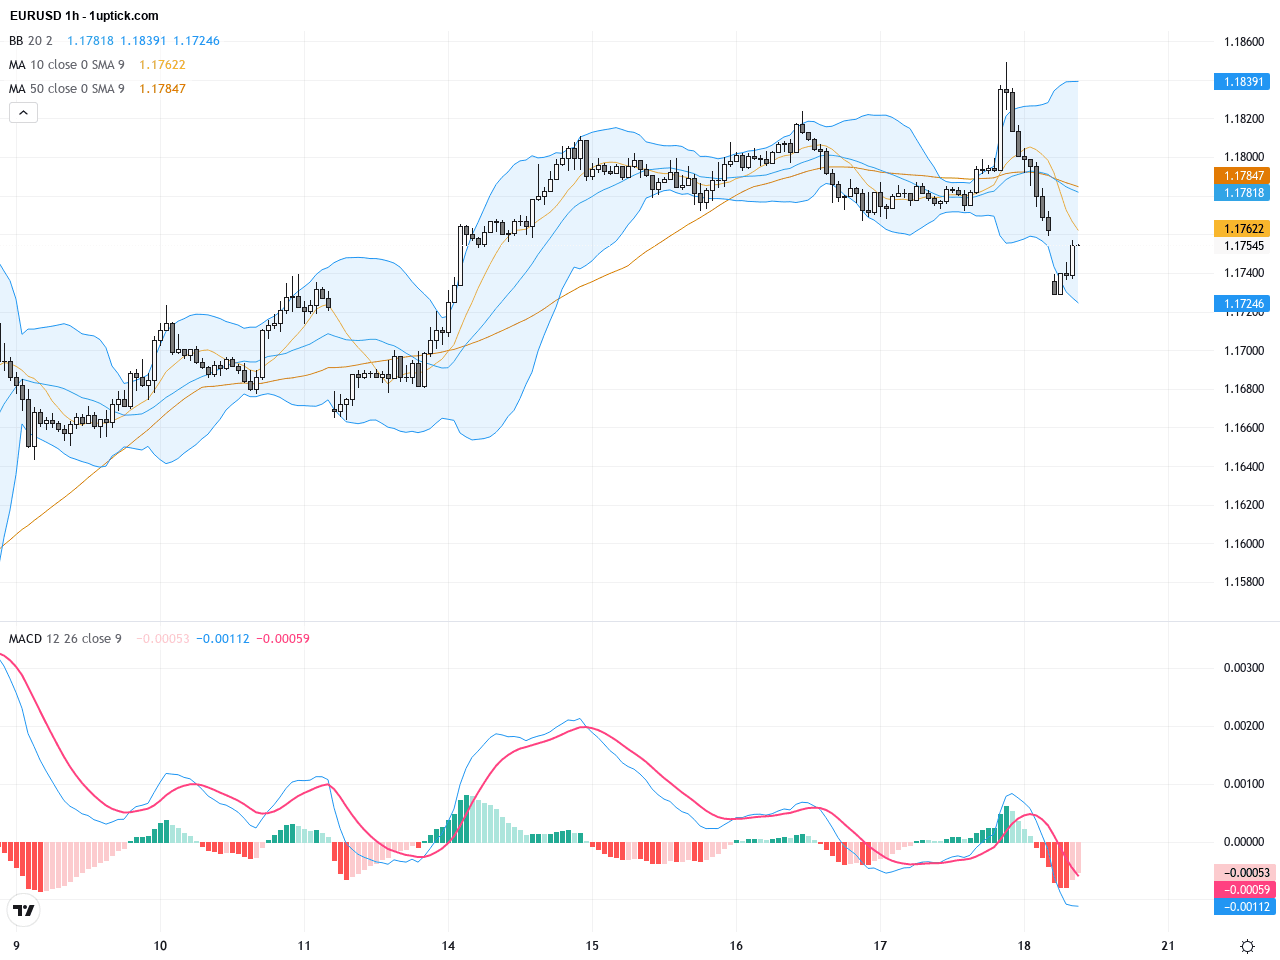
The past five days on the hourly chart show consolidation followed by a breakout around 9:00 AM HKT. The short-term moving averages (5 and 20 MA) have formed a golden cross, and prices have reclaimed the middle Bollinger Band. The MACD lines crossed positively, with histogram bars turning bullish, boosting short-term buying confidence. A recent engulfing candlestick near 1.17750 indicates further upside potential. On the short-term chart, EURUSD momentum is strengthening with reduced downside risk.
Technical Trend: Strong Bullish Trend
Technically, EURUSD is signaling multiple bullish cues. The daily chart’s break above key moving averages confirms an upward trend, while the hourly chart’s golden cross and bullish engulfing candlestick pattern support further gains in the short term. The MACD positive reading indicates strong bullish energy. Additionally, the expanding Bollinger Bands highlight rising volatility, offering traders enhanced profit opportunities. Nonetheless, caution remains warranted given the evolving Middle East tensions and trade uncertainties.Today’s global economic calendar features no significant or direct events impacting EURUSD. Traders should continue monitoring subsequent Eurozone and US news alongside geopolitical developments for further cues.
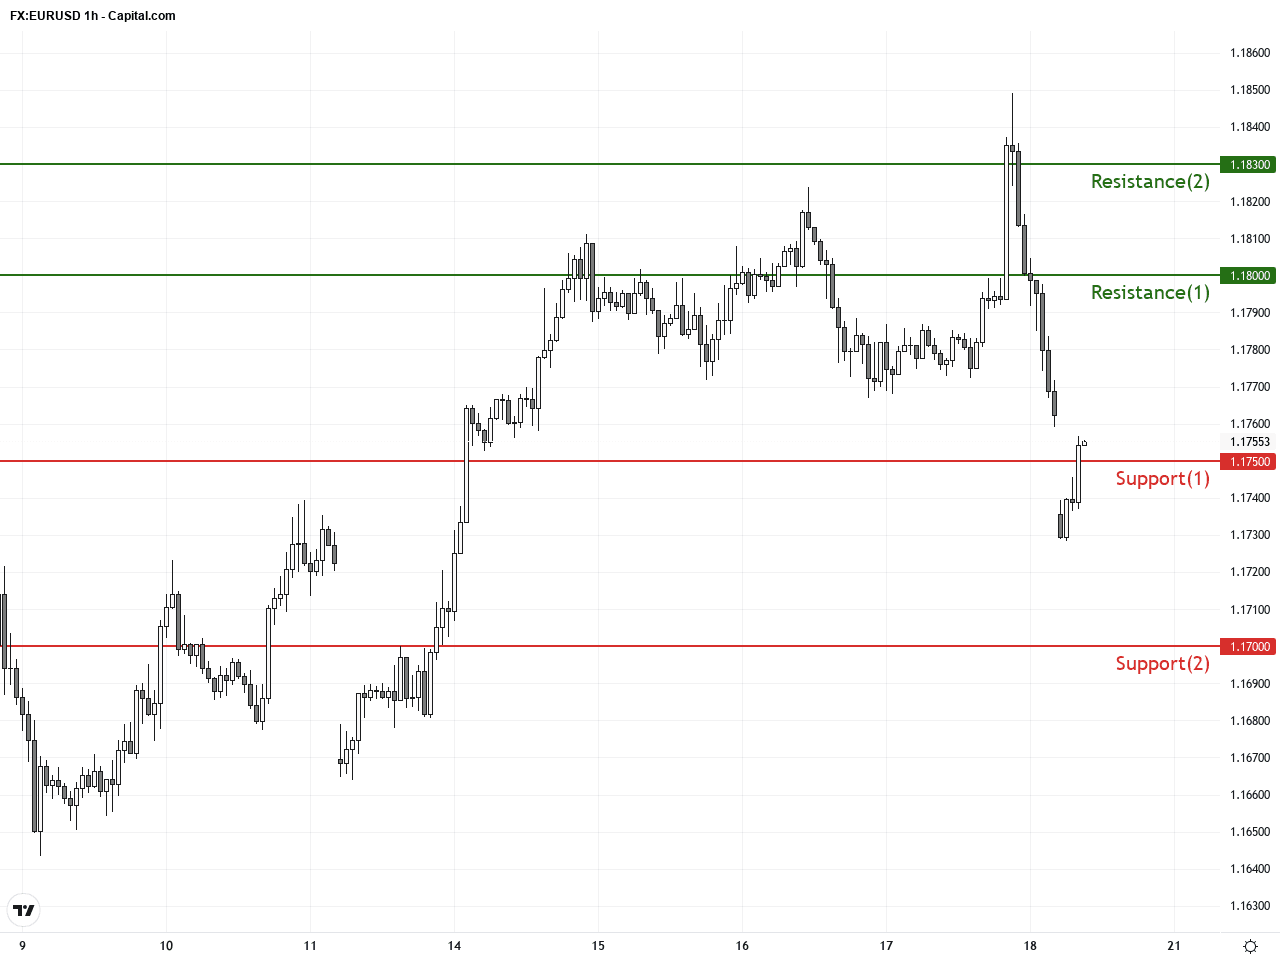
Resistance & Support
The above financial market data, quotes, charts, statistics, exchange rates, news, research, analysis, buy or sell ratings, financial education, and other information are for reference only. Before making any trades based on this information, you should consult independent professional advice to verify pricing data or obtain more detailed market information. 1uptick.com should not be regarded as soliciting any subscriber or visitor to execute any trade. You are solely responsible for all of your own trading decisions.