







 |
| Gold V.1.3.1 signal Telegram Channel (English) |
GBPUSD: Technical Rebound Opportunity as Dollar Support Strengthens, May 25, 2026
2026-05-25 @ 13:01
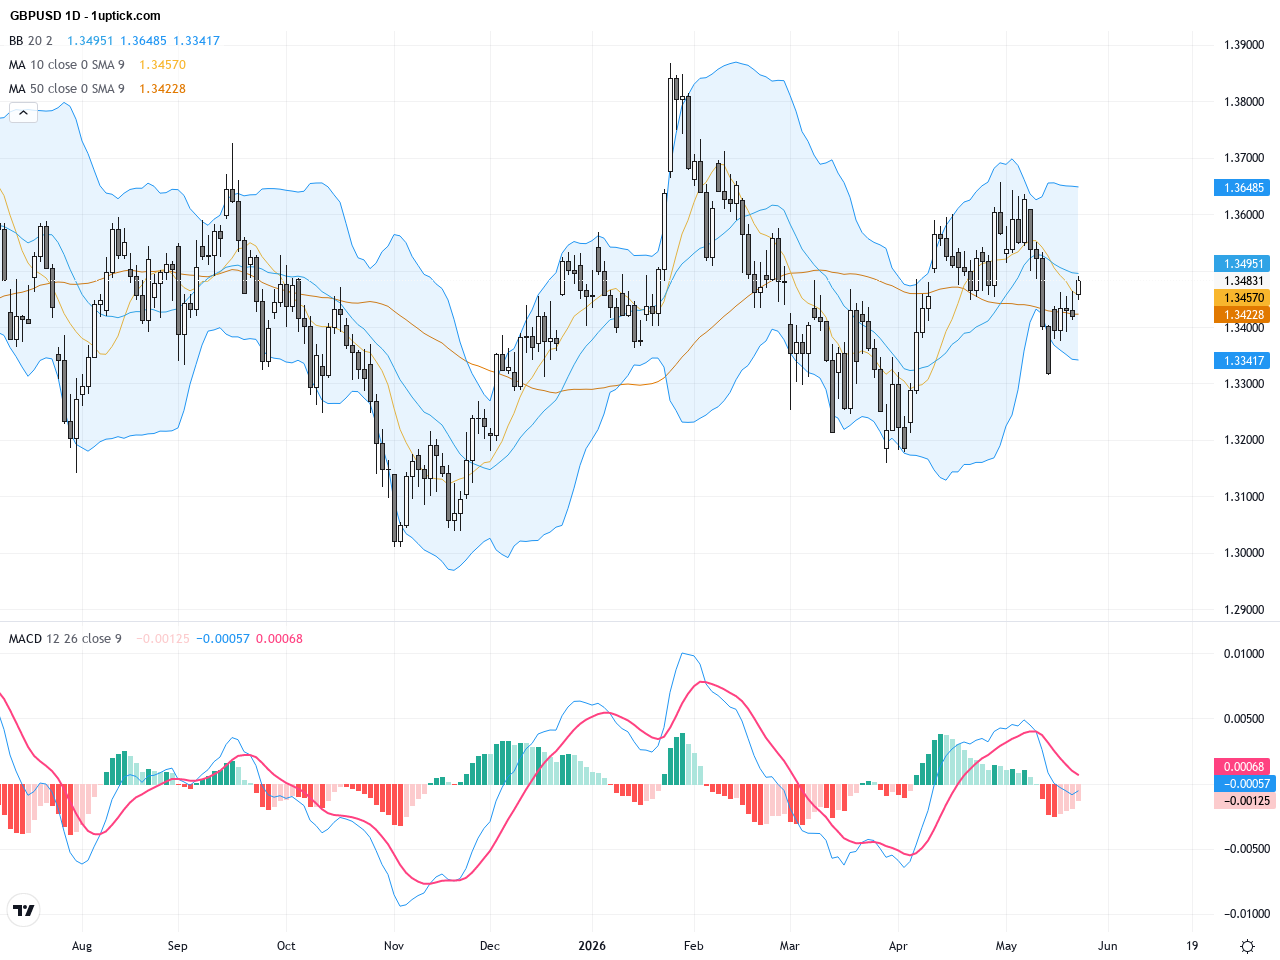
Over the past 24 to 48 hours, GBP/USD has experienced notable volatility. The pair closed the day before yesterday at 1.34195, opened yesterday at 1.34587, and ended at 1.3483, showing a mild upward trend overall. This movement was largely influenced by the recent slump in oil prices and easing geopolitical tensions in the Middle East.
Recent market news highlighted progress towards a ceasefire between the US and Iran, which led to a swift unwinding of the geopolitical risk premium, pushing crude oil futures to a nearly two-week low with a drop of about 5%. This significant adjustment in the energy market eased pressure on the British Pound, helping GBP/USD remain relatively resilient amidst ongoing uncertainties. However, weaker UK economic data, such as the PMI dropping to 48.5 indicating contraction in the services sector, along with persistent inflationary pressures, have somewhat capped a robust rebound for the Pound.
For everyday investors, this means GBP/USD’s price action is reflecting reduced risk aversion due to eased global political tensions but also caution stemming from the UK’s internal economic struggles. Investors should remain watchful, closely monitoring developments in the Middle East alongside UK economic reports, to better gauge the currency’s future direction.
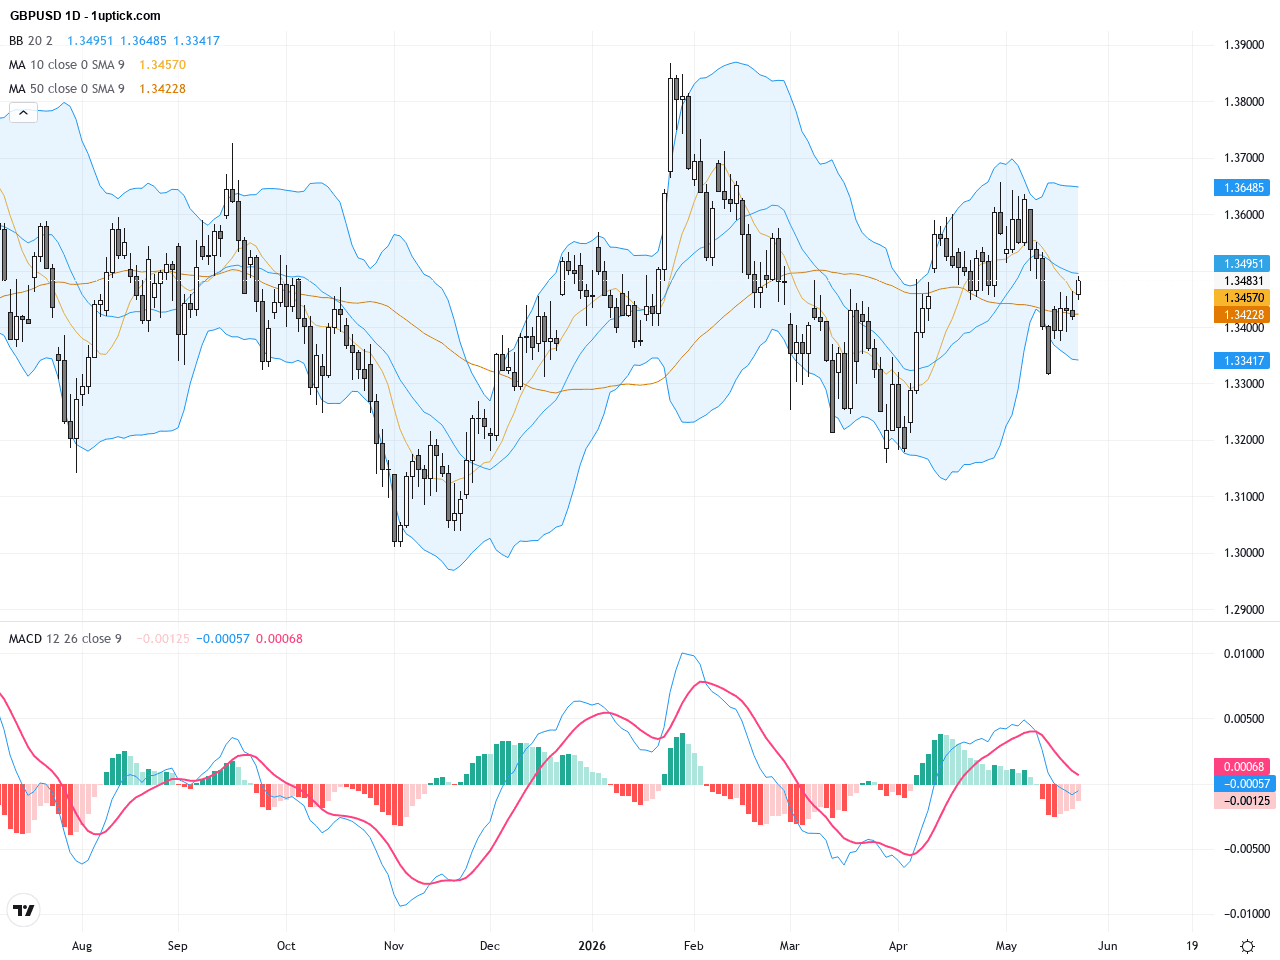
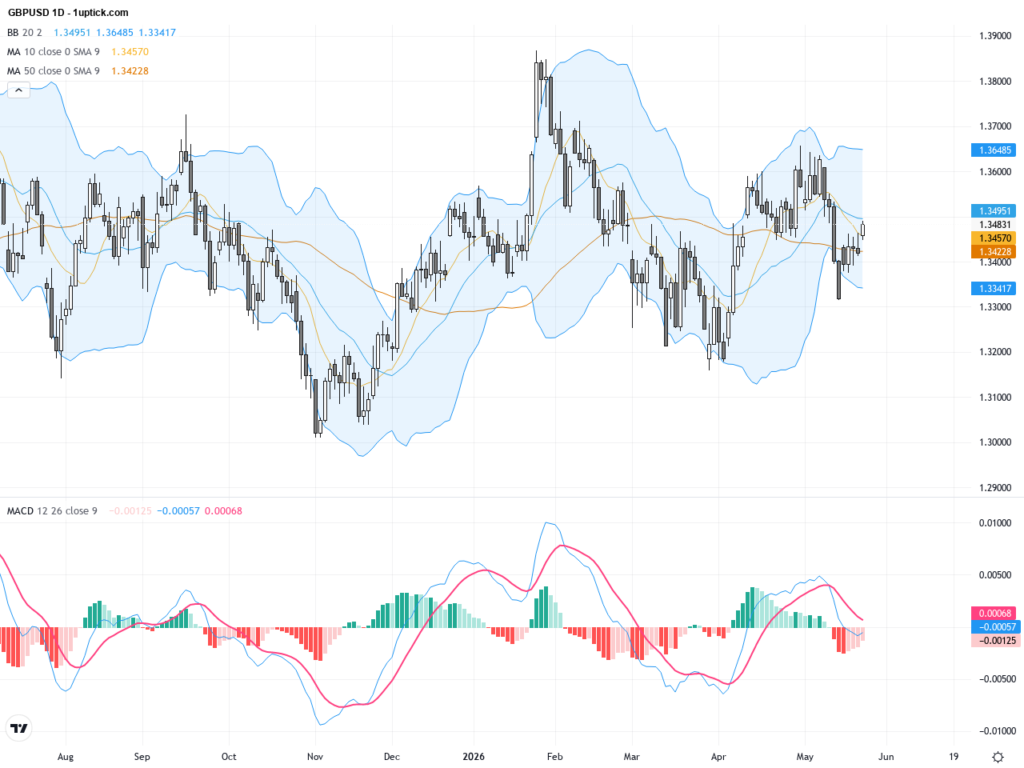
The GBPUSD daily chart shows a steady oscillating rebound pattern, with price moving within the 1.34 to 1.35 range. Moving averages indicate a bullish alignment, with the 50-day SMA near 1.3443 above the 200-day SMA at 1.3403, favoring a medium-term uptrend. Bollinger Bands are narrowing slightly and trending upwards, suggesting consolidation with potential for breakout. The MACD remains mildly bullish but lacks strong momentum, signaling the trend is still awaiting confirmation. Overall, the daily trend signals recovery attempts, but strong resistance near 1.35 could trigger further sideways movements.

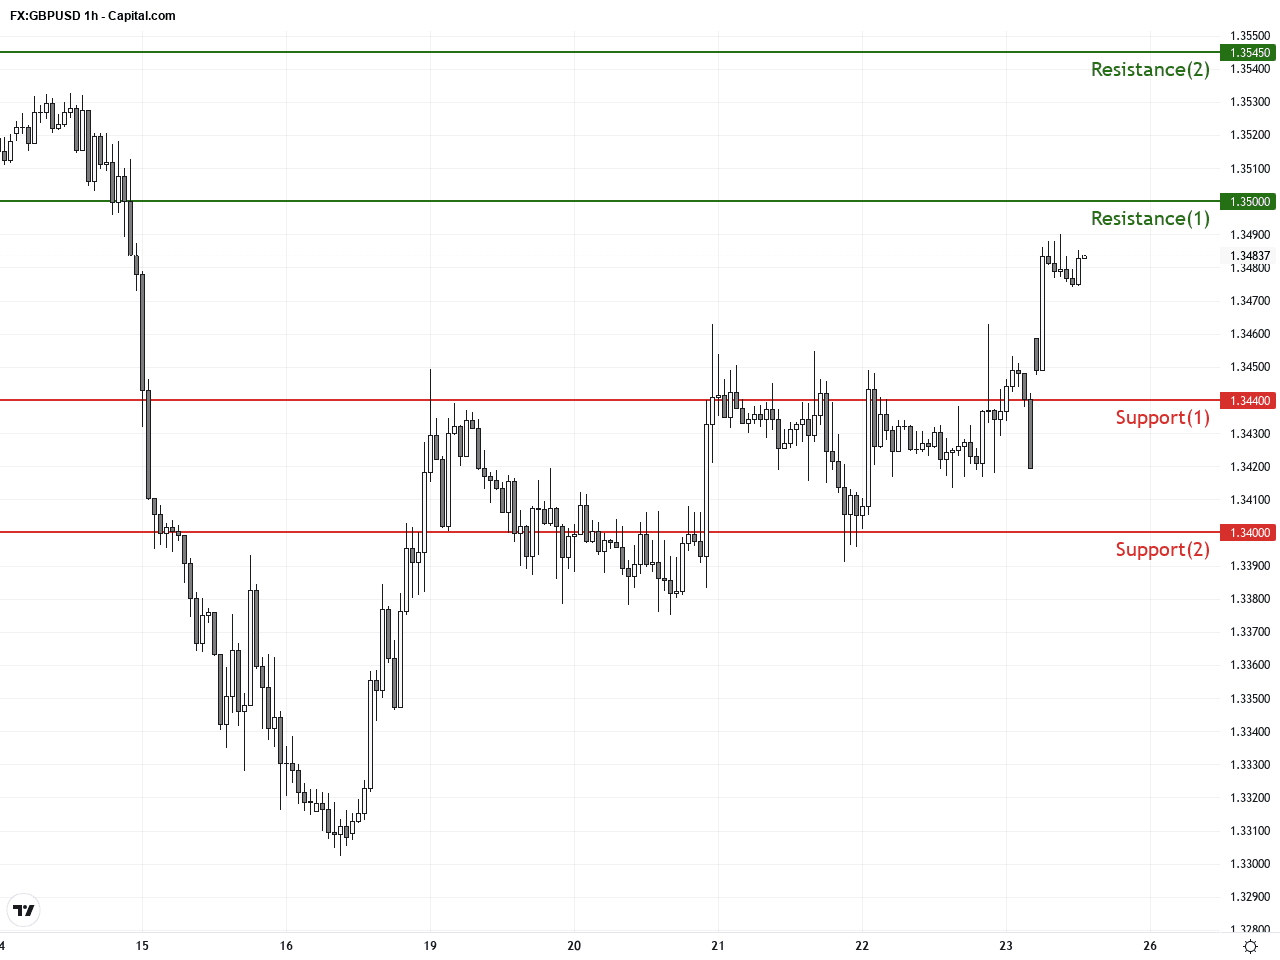
The hourly chart over the past 5 days shows GBPUSD rebounding from lows near 1.3445, breaking above short-term moving averages. The 9- and 21-hour EMAs have formed bullish crosses. Bollinger Bands expansion signals increased short-term volatility. The MACD lines recently crossed bullishly, while RSI has climbed to around 60, indicating strengthening momentum. Notably, a consolidating triangle pattern suggests that a breakout above psychological resistance at 1.35 could lead to continued gains. Traders should watch the dynamic between support around 1.3440 and resistance at 1.3500 for possible short-term trade setups.
Technical Trend: GBPUSD is exhibiting a Cautiously Bullish trend, balancing between consolidation and a potential breakout.
Technically, GBPUSD is in a cautious rebound phase. Daily charts show bullish moving average alignments hinting at a mid-term uptrend, though momentum has yet to fully develop. Hourly charts reveal short-term bullish signals including moving average crossovers and MACD buy signals paired with increased volatility as Bollinger Bands widen. The ongoing consolidation triangle is a key technical pattern suggesting potential for a breakout. Once confirmed, such a breakout could provide a clearly defined trading opportunity. Overall, the chart signals that while a technical rally is possible, the ability to break above the key 1.35 resistance will be crucial.The economic calendar today in GMT+1 features Polish retail sales and money supply M3 data, which are unlikely to directly impact GBPUSD as they involve non-GBP and USD currencies. No significant or direct economic events scheduled for today that would materially affect GBPUSD. Therefore, traders should focus more on technical and market sentiment developments.
Resistance & Support
The above financial market data, quotes, charts, statistics, exchange rates, news, research, analysis, buy or sell ratings, financial education, and other information are for reference only. Before making any trades based on this information, you should consult independent professional advice to verify pricing data or obtain more detailed market information. 1uptick.com should not be regarded as soliciting any subscriber or visitor to execute any trade. You are solely responsible for all of your own trading decisions.