


 |
| Gold V.1.3.1 signal Telegram Channel (English) |

EURUSD Technical Outlook: Consolidation Near Critical Resistance Zone
2026-04-22 @ 09:01
Over the past 24 to 48 hours, EUR/USD traded closely around the 1.1750 level, showing slight fluctuations from yesterday’s close at 1.1744. The US dollar corrected following the announcement of a two-week ceasefire between the US and Iran, yet geopolitical tensions remain elevated, especially with escalating risks in the Strait of Hormuz, continuing to pressure the market.
Reports suggest that initially markets priced in a positive outlook; however, renewed Middle East conflicts combined with rising oil prices brought mixed reactions. This drove EUR/USD lower as the euro’s safe-haven appeal weakened amidst intensifying uncertainty. For the average investor, this means geopolitical risks remain a critical driver of currency volatility, where any new developments can rapidly shift foreign exchange dynamics.
Looking at the bigger picture, the dollar’s sharp correction outlines risk-off flows, while highlighting market sensitivity to Federal Reserve policy expectations and oil price trends. Investors should closely monitor geopolitical events and US monetary policy signals as key factors influencing future market moves.

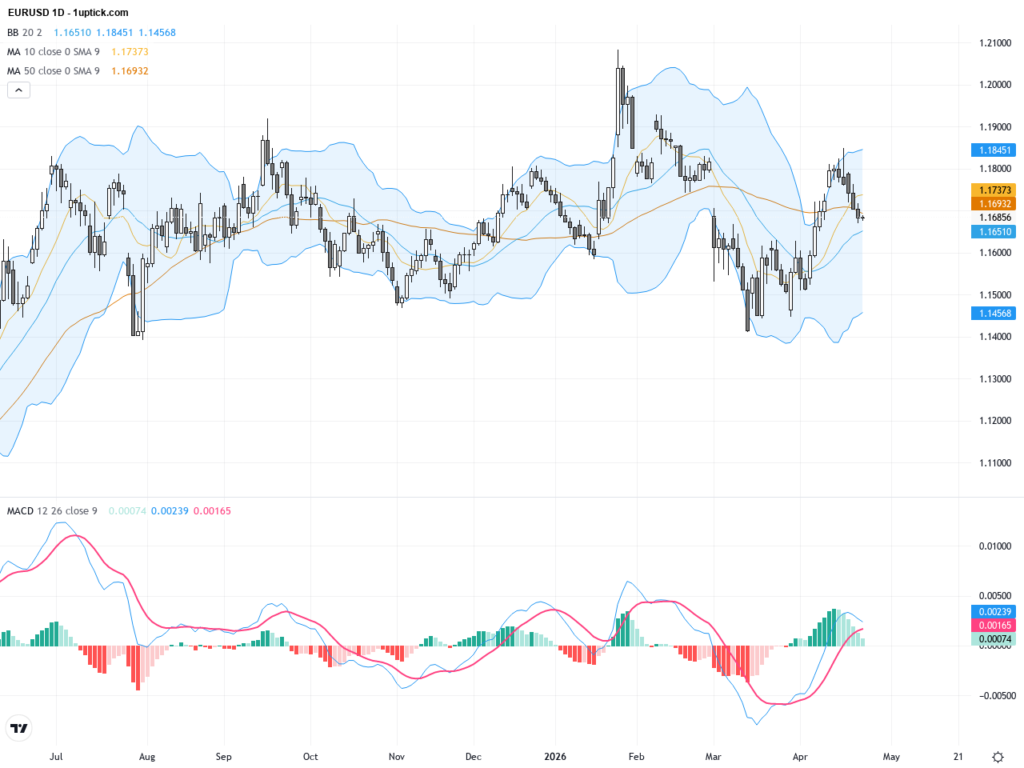
The daily chart illustrates EURUSD trending within a broad upward channel, rebounding from recent lows and attempting to clear the critical resistance near 1.18. The 50-day moving average (around 1.163) and 200-day moving average (around 1.168) maintain a bullish alignment with price action holding above the 200 MA acting as support. Bollinger Bands have widened, indicating increased volatility. The MACD remains positive though histogram bars show slight contraction, signaling short-term momentum cooling but with longer-term trend intact.
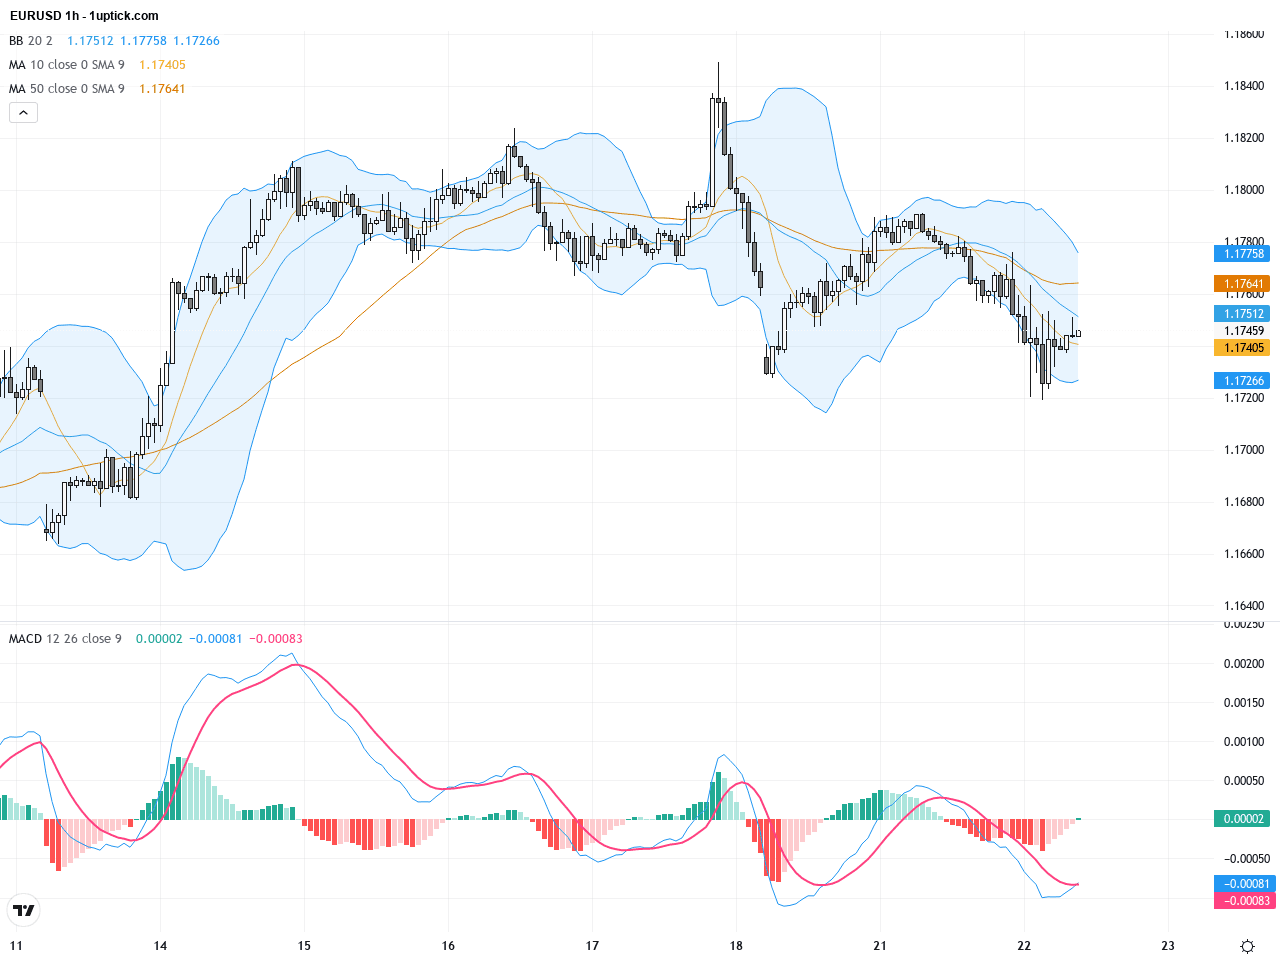
The hourly chart highlights a choppy sideways price movement over the last 3-5 days influenced by fluctuating news flow. After a brief breakout above 1.18, price pulled back and now oscillates between 1.1740 and 1.1770. Short-term moving averages reveal tightening oscillation and Bollinger Bands narrowing, suggesting a potential imminent breakout. MACD fast line slightly declines but no bearish crossover yet; RSI hovers near neutral zone. Traders should closely watch volume and volatility for early breakout clues.
Technical Trend: EURUSD currently displays a consolidating trend with cautious bullish bias, characterized by increased volatility and awaiting a decisive breakout to define next directional move.
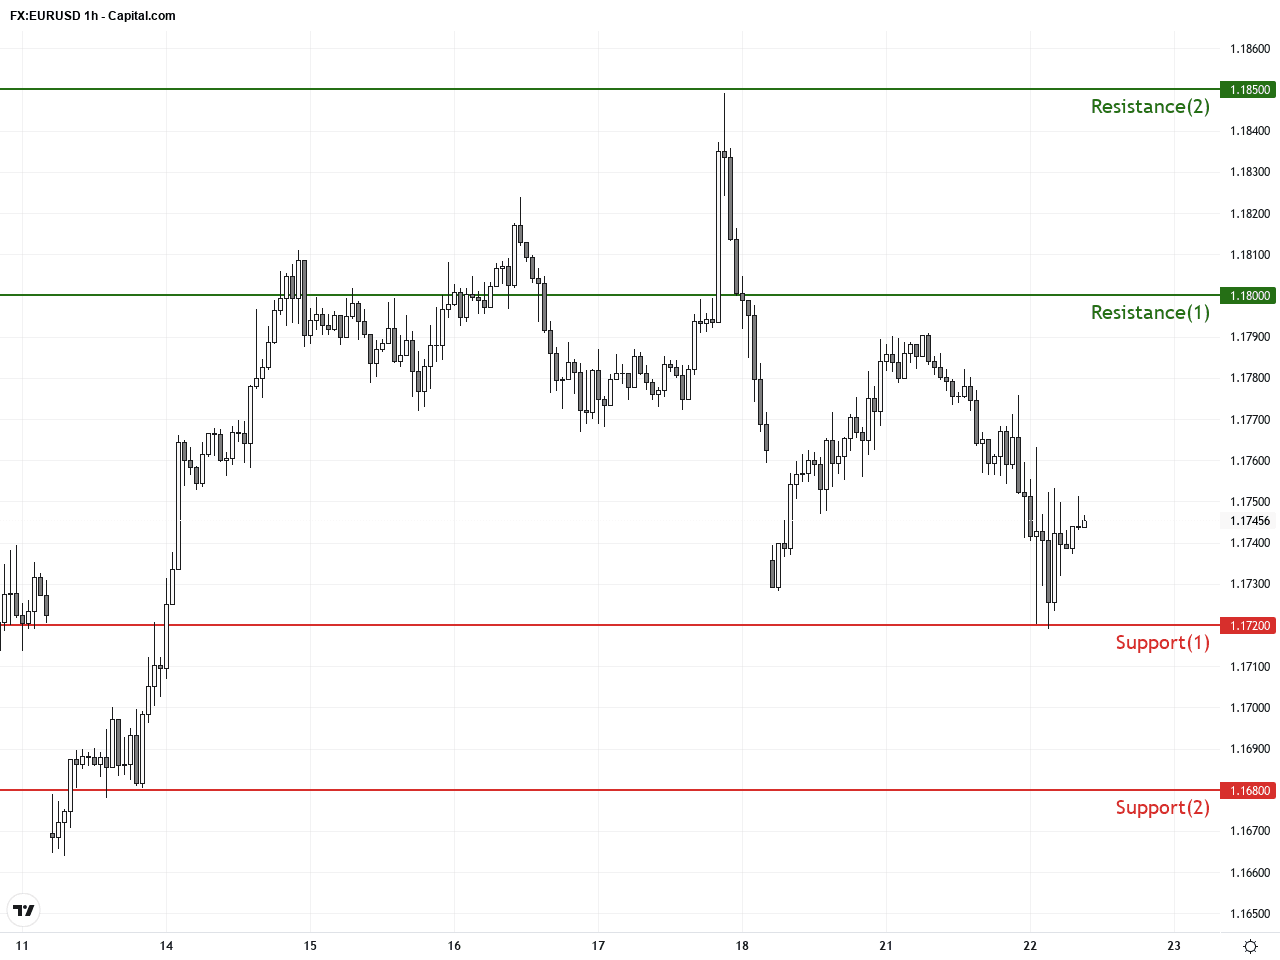
From a technical standpoint, a symmetrical triangle pattern has started forming on the daily chart near 1.18, hinting at a possible breakout with momentum expansion. The recent bearish engulfing candlestick cautions of short-term pullbacks. Momentum indicators such as MACD and volume suggest a mixed outlook with cautious bias. Traders should focus on the hourly chart’s narrowing Bollinger Bands and MACD development to position ahead of a likely directional move. Key levels like 1.1720 support and 1.18 resistance are pivotal for tactical entries.Today’s economic calendar shows limited direct impact events for EURUSD. Early Asian session at 01:50 GMT+1 features Japan’s March trade balance, exports, and imports data which have minimal immediate effect on EURUSD. Around 08:00 GMT+1, UK inflation data including the Consumer Price Index is scheduled, potentially influencing broader market sentiment tied to the Eurozone and USD indirectly. Market focus later shifts to US crude oil inventory data at 16:30 GMT+1, which could affect dollar strength and thus EURUSD price. Overall, no major direct economic events today; geopolitical factors remain dominant drivers.
Resistance & Support
The above financial market data, quotes, charts, statistics, exchange rates, news, research, analysis, buy or sell ratings, financial education, and other information are for reference only. Before making any trades based on this information, you should consult independent professional advice to verify pricing data or obtain more detailed market information. 1uptick.com should not be regarded as soliciting any subscriber or visitor to execute any trade. You are solely responsible for all of your own trading decisions.