


 |
| Gold V.1.3.1 signal Telegram Channel (English) |

GBPUSD Technical & Fundamental Analysis: Price Holds Near 1.34626 Amid Key Support and Resistance Levels
2026-04-24 @ 13:01
Over the past 24 to 48 hours, the GBP/USD currency pair has experienced noticeable volatility. Yesterday’s closing price stood at 1.34626, marking a slight decline of 0.039% from the previous day. The overall movement reflects strong support for the US Dollar Index (DXY) amid escalating tensions in the Middle East, which in turn has pressured GBP/USD. The US-Iran peace talks have stalled due to rising friction, intensifying safe-haven demand and pushing the dollar index to around 98.65, forcing the pound to weaken.
Moreover, rising oil prices combined with falling equities have created a dominant cross-asset momentum that favors safe-haven assets like the dollar. This dynamic has been the key driver behind GBP/USD fluctuations in the last day or two. When risk aversion rises, risk currencies such as the pound are naturally sold off, reflected in the currency’s decline.
For the average investor, this currency movement resembles a reflex to heightened insecurity. The regional tensions are like an unexpected disturbance at home, prompting investors to retreat to the safer haven of the dollar and temporarily step away from riskier pound investments. While US-Iran diplomacy injects volatility, it also serves as a reminder to approach the forex market with caution in the short term.
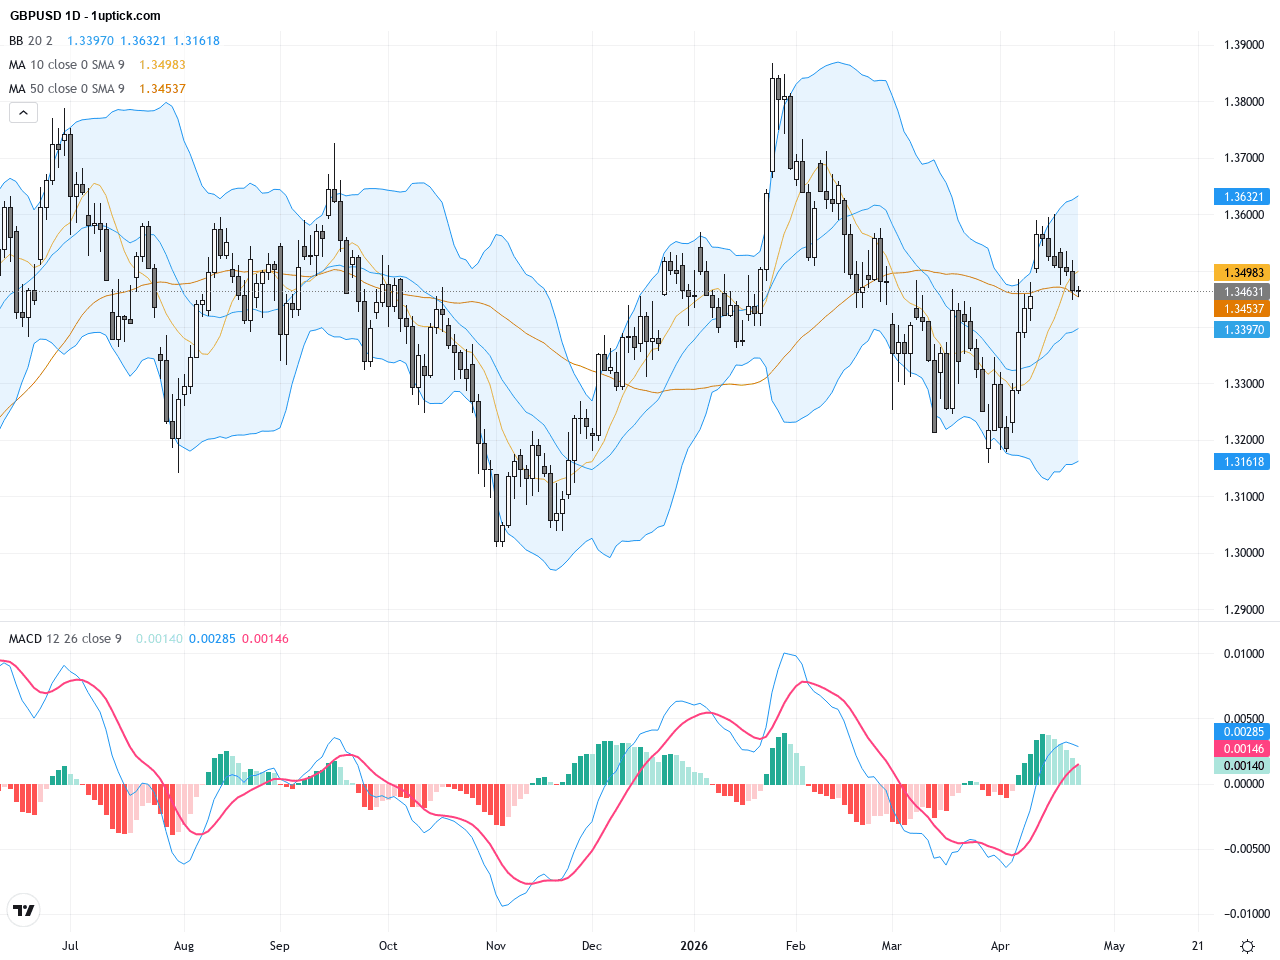
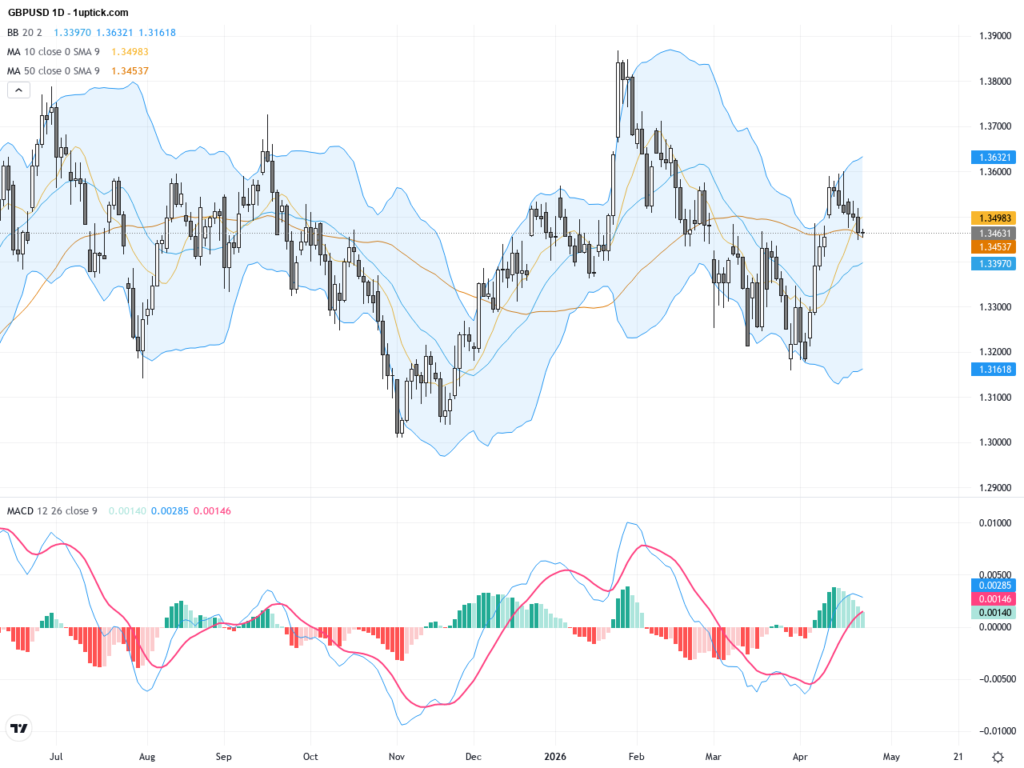
The daily chart reveals GBPUSD in a choppy but generally upward retracement trend since early 2026 lows near 1.3010. The pair currently trades above key moving averages—the 50-day MA at 1.33776 and the 200-day MA at 1.34024—supporting a sustained bullish bias. Bollinger Bands widths have expanded, reflecting increased volatility, while MACD remains above zero and widening, confirming positive momentum. An inverted head-and-shoulders pattern is forming, which if confirmed via neckline breakout, could signal further upside potential in the medium term.
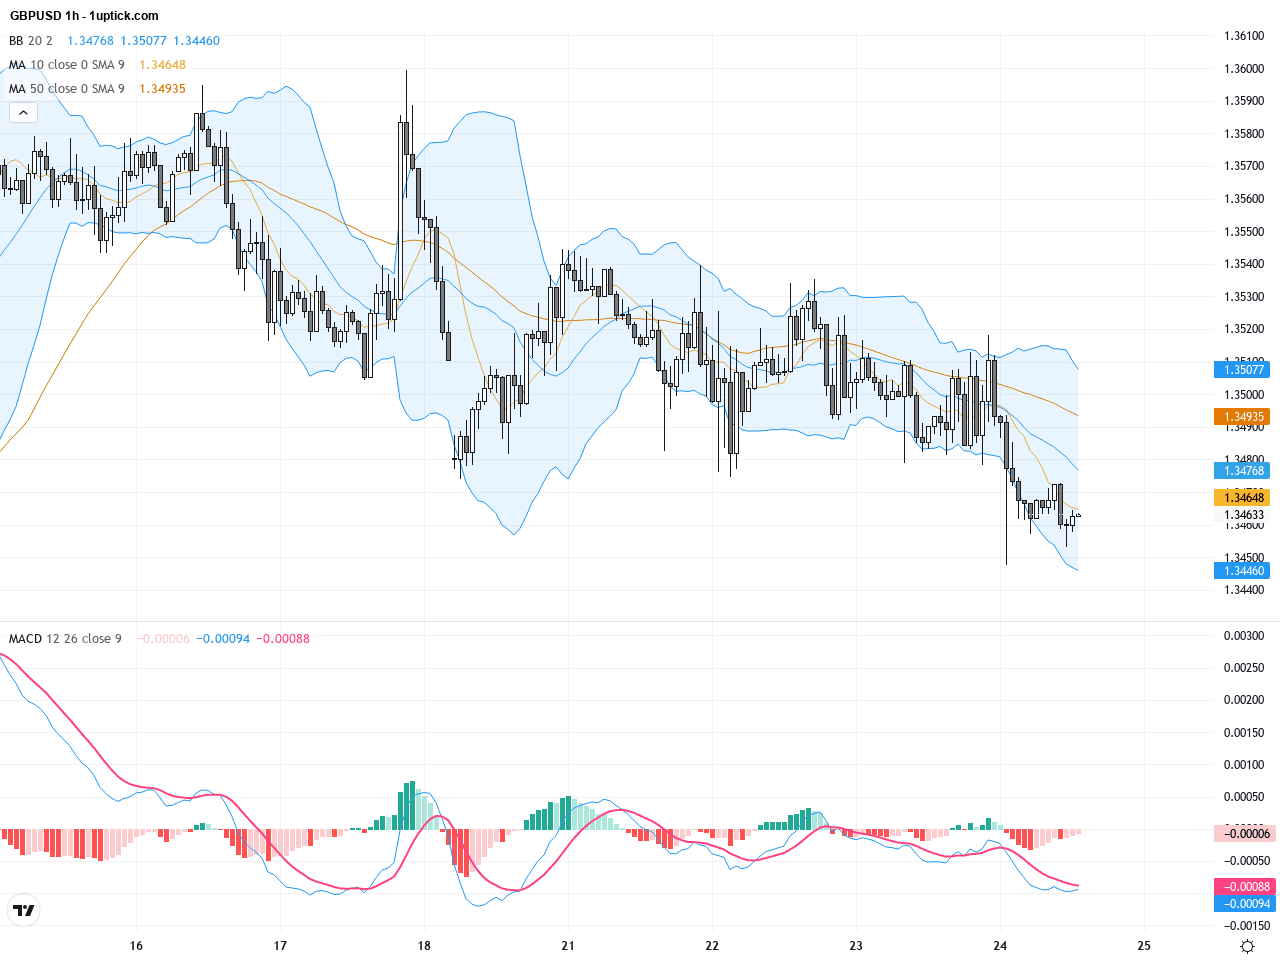
On the hourly timeframe, GBPUSD has been range-bound between roughly 1.3440 and 1.3480 over the past 3–5 days. Moving averages show indecision with short-term MAs hovering close to the 200-hour MA. The MACD histogram hints at waning momentum but potential for a bullish crossover soon, signaling a possible short-term upward push. Bollinger Bands are narrowing, indicating imminent breakout potential. The formation of a symmetrical triangle pattern suggests traders should watch closely for a directional breakout with increased volume confirmation.
Technical Trend: GBPUSD currently exhibits a cautiously bullish trend exhibiting steady oscillations with clear support zones and potential for upside. The pair is best described as in a “steady upward consolidation,” where traders should adopt measured entry points and risk management to capitalize on developing momentum.
Key technical insights include 1) the inverted head-and-shoulders pattern developing on the daily chart that could mark a medium-term bottom, 2) the approaching bullish MACD crossover on the hourly chart indicating increasing short-term buying momentum, and 3) recent bullish engulfing candlestick patterns suggest strengthening buyer interest. The outlook is cautiously optimistic, but ongoing geopolitical and fundamental developments should be monitored closely as they may introduce volatility beyond technical triggers.Today’s GMT+1 economic calendar highlights the UK’s March retail sales releases at 08:00, with forecasts anticipating 1.3% year-over-year growth and a modest 0.2% month-over-month increase. Positive retail sales could underpin a stronger British Pound and support GBPUSD gains. Japanese CPI data released earlier showed slight upticks but pose limited immediate impact on GBPUSD. No major US data directly influencing GBPUSD is scheduled today. Thus, market focus will likely center on UK data for potential directional cues.
Resistance & Support

The above financial market data, quotes, charts, statistics, exchange rates, news, research, analysis, buy or sell ratings, financial education, and other information are for reference only. Before making any trades based on this information, you should consult independent professional advice to verify pricing data or obtain more detailed market information. 1uptick.com should not be regarded as soliciting any subscriber or visitor to execute any trade. You are solely responsible for all of your own trading decisions.