


 |
| Gold V.1.3.1 signal Telegram Channel (English) |
GBPUSD: Key Moving Average Breakout Signals Cautious Bearish Consolidation
2026-04-20 @ 13:01
Over the past 48 hours, the GBP/USD pair experienced notable fluctuations. Starting from yesterday’s closing price of 1.35048, the pair showed some bearish pressure indicating a slight weakening of bullish momentum. During this period, the US dollar moved in response to US-Iran tensions and subsequent diplomatic easing, directly influencing the pound.
Recent market news highlights that rising US-Iran tensions initially bolstered the US dollar, putting pressure on GBP/USD. However, as diplomatic talks between the US and Iran raised hopes for easing conflict, risk appetite returned, causing the dollar to retreat and the pound to stabilize near pre-war levels. This movement reflects investors’ sensitivity to geopolitical risks, while also showing pound bulls defending key technical support levels.
For the average investor, the last two days resemble a rollercoaster: concerns over geopolitical risks sparked safe-haven demand boosting the dollar and weighing on the pound; yet, hope for peace talks revived confidence in risk assets, supporting the pound. This underscores the need for investors to closely monitor international political developments that can swiftly impact forex markets.

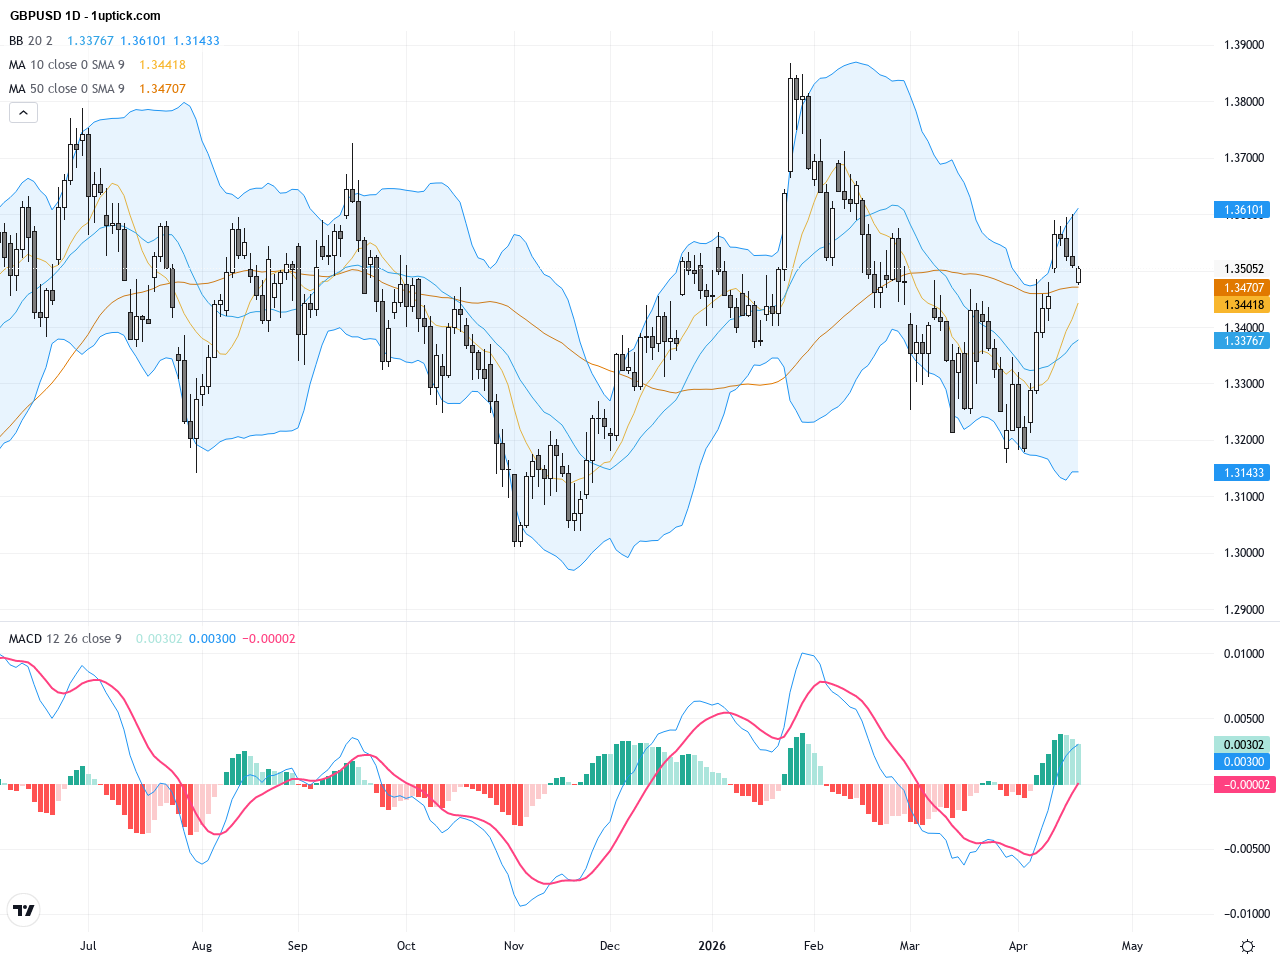
Examining the daily chart, GBPUSD has experienced a clear structural breakout, notably holding above the 200-day moving average at 1.34027 and 50-day moving average at 1.3376. The price has steadily rebounded from lows over the past weeks, confirming an upward trend. The MACD indicator shows a bullish crossover indicating mid-term momentum turning positive. Bollinger Bands are widening after a period of contraction, suggesting an increase in volatility. The long-term trend is bullish, emphasizing watchfulness for moving average support validity.
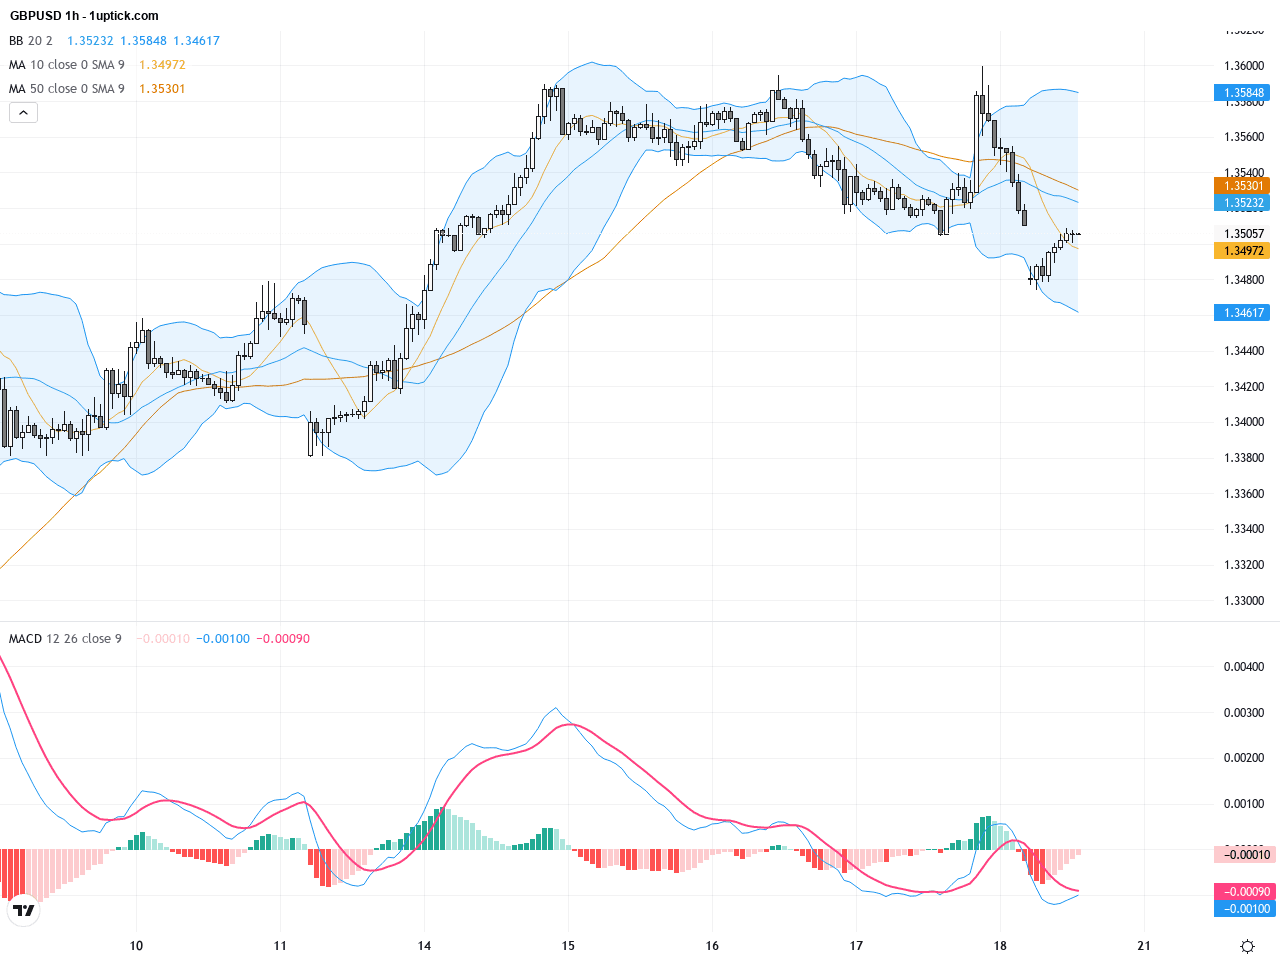
The 4-hour chart over the last 3-5 trading days shows GBPUSD in a mild uptrend with consolidation. The price has repeatedly found support around 1.3500, forming a small symmetrical triangle. MACD and RSI show momentum easing without bearish signals. Bollinger Bands narrowing implies limited short-term volatility. A breakout above 1.3550 resistance could trigger a fresh rally, while a break below 1.3470 support might accelerate downside risk.
Technical Trend: The current trend is cautiously bullish with the overall structure favoring uptrend but short-term consolidation phase ongoing.
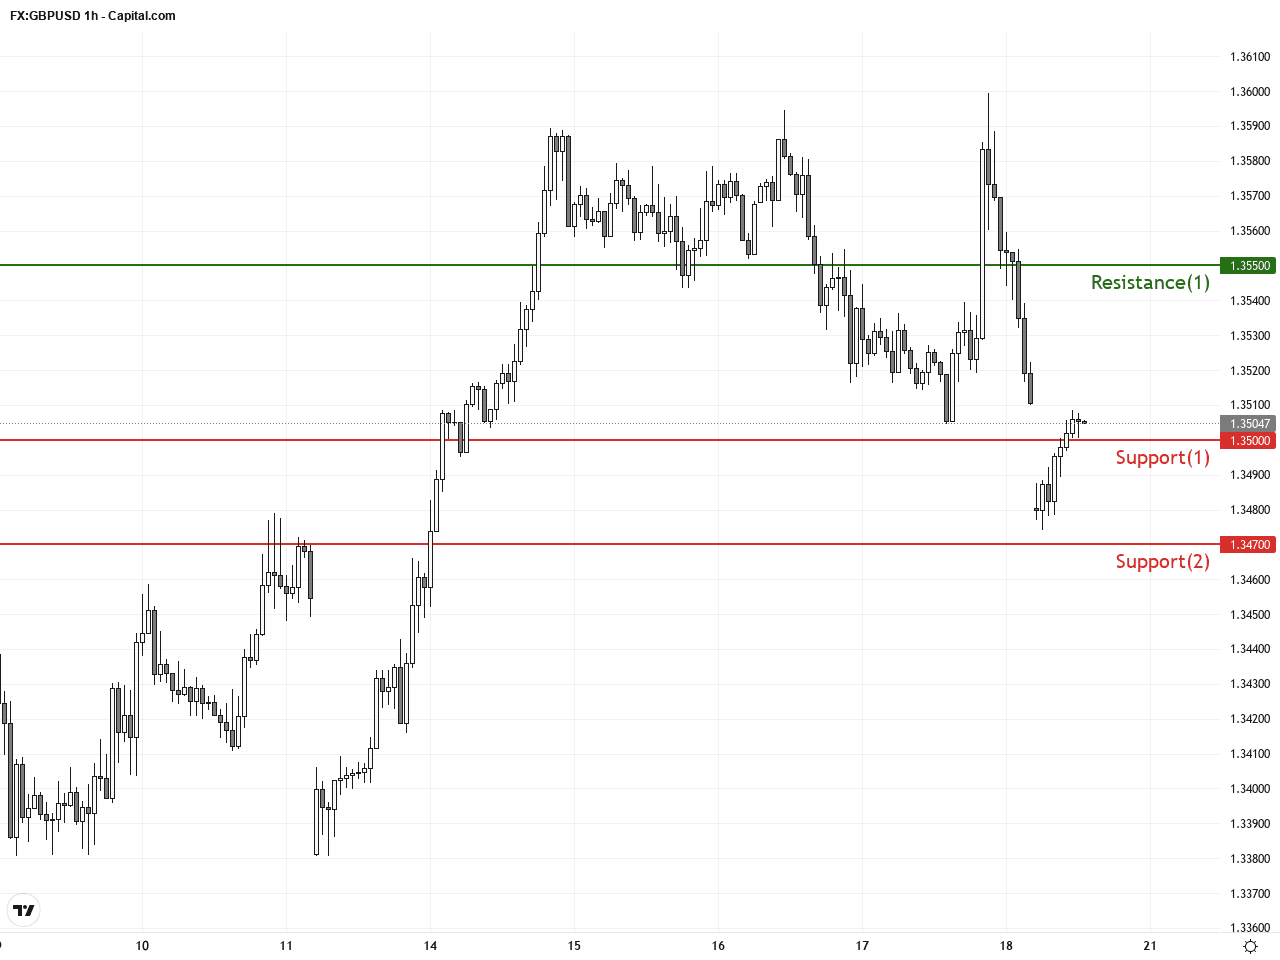
The most critical technical insight for GBPUSD is the structural breakout seen on the daily chart, shifting the market sentiment from bearish to bullish. The small triangle pattern on the 4-hour chart suggests a near-term breakout is likely. Yesterday’s bearish engulfing candlestick indicates sellers remain active but no decisive downturn has occurred yet. A break above 1.3550 resistance would confirm bullish momentum continuation toward 1.3700. Support focus remains on short-term moving averages and the 1.3470 level.Today’s economic calendar lacks significant or direct events impacting GBPUSD. Key releases include Canadian Consumer Price Index and Core CPI, indirectly affecting the pair via CAD movement. ECB President’s speech could impact European market sentiment and indirectly influence GBPUSD. Other data from New Zealand, Czech Republic, and Germany hold limited relevance due to timing and currency correlation. Overall, no major immediate economic data is expected to move GBPUSD today.
Resistance & Support
The above financial market data, quotes, charts, statistics, exchange rates, news, research, analysis, buy or sell ratings, financial education, and other information are for reference only. Before making any trades based on this information, you should consult independent professional advice to verify pricing data or obtain more detailed market information. 1uptick.com should not be regarded as soliciting any subscriber or visitor to execute any trade. You are solely responsible for all of your own trading decisions.