 |
| Gold V.1.3.1 signal Telegram Channel (English) |
USDCAD Faces Critical Support Test Amid Volatile Trading Outlook
2026-04-28 @ 13:02
Over the past 24 to 48 hours, the USD/CAD pair has continued to weaken, hovering near 1.36 and approaching a two-month low. Using yesterday’s closing price of 1.36331 as a reference, the pair is under considerable selling pressure in this zone, reflecting investor caution over the currency outlook between the US dollar and Canadian dollar.
Markets are closely awaiting this week’s interest rate decisions from two major central banks: the Federal Reserve (Fed) and the Bank of Canada (BoC). These decisions directly influence the USD/CAD exchange rates. Coupled with recent geopolitical developments, especially potential progress in US-Iran talks, demand for the USD as a safe haven has diminished, driving the dollar weaker and pushing USD/CAD lower.
At the same time, rising oil prices have supported the commodity-linked Canadian dollar. The oil price surge has strengthened the CAD against the USD, contributing to the USD/CAD pair reaching a seven-week low. Additionally, broad US dollar softness and improving risk sentiment have added to the downside pressure on the pair.
For the typical investor, a weakening USD amid lessened geopolitical risk and a stronger CAD supported by higher oil prices and central bank prospects means higher volatility in currency pairs like USD/CAD. This volatility impacts cross-border trades and investment returns. Investors should watch the upcoming Fed and BoC policy announcements closely, as these are critical in shaping USD/CAD’s next directional move.
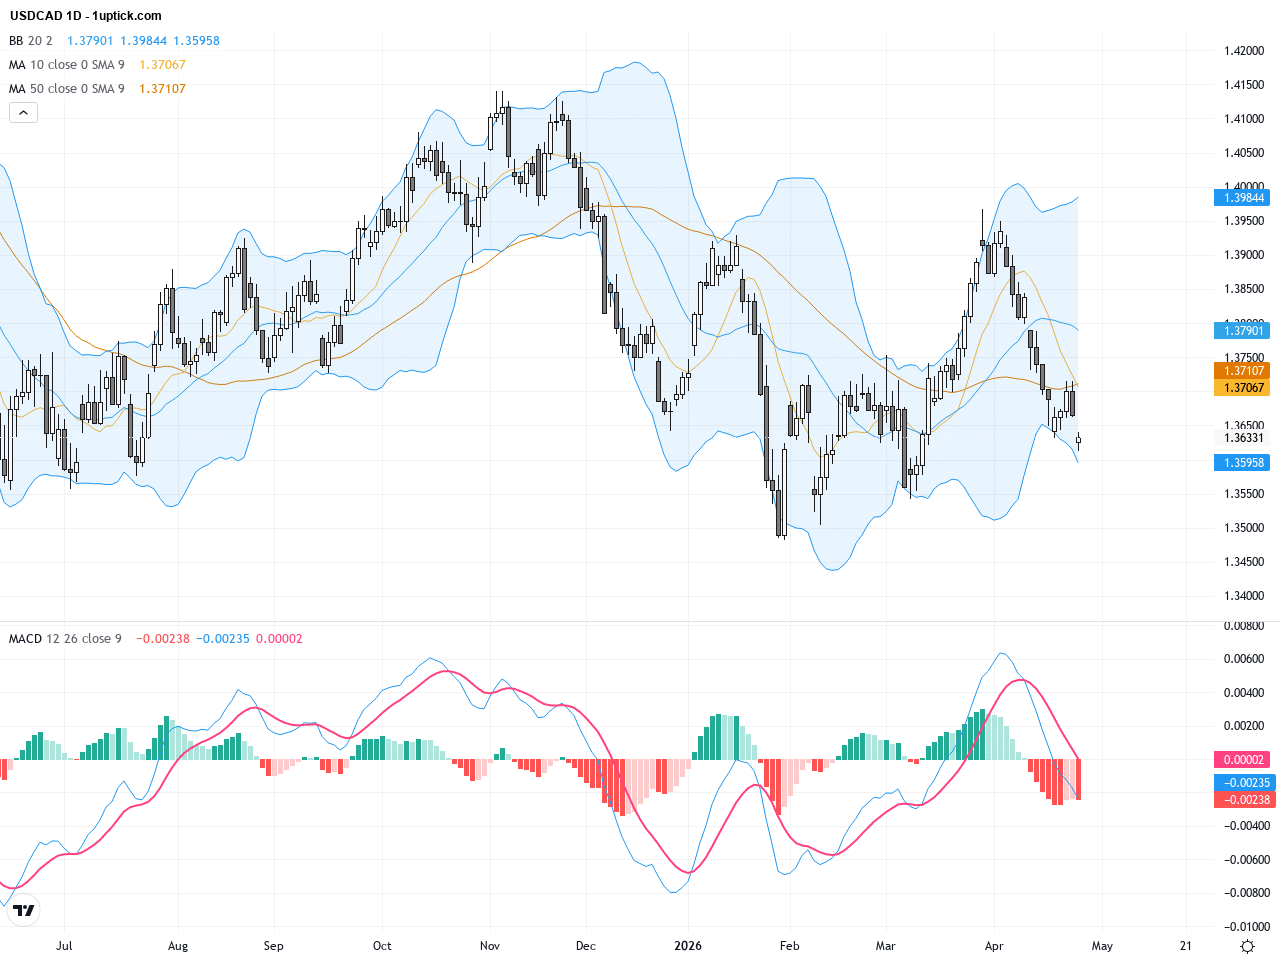
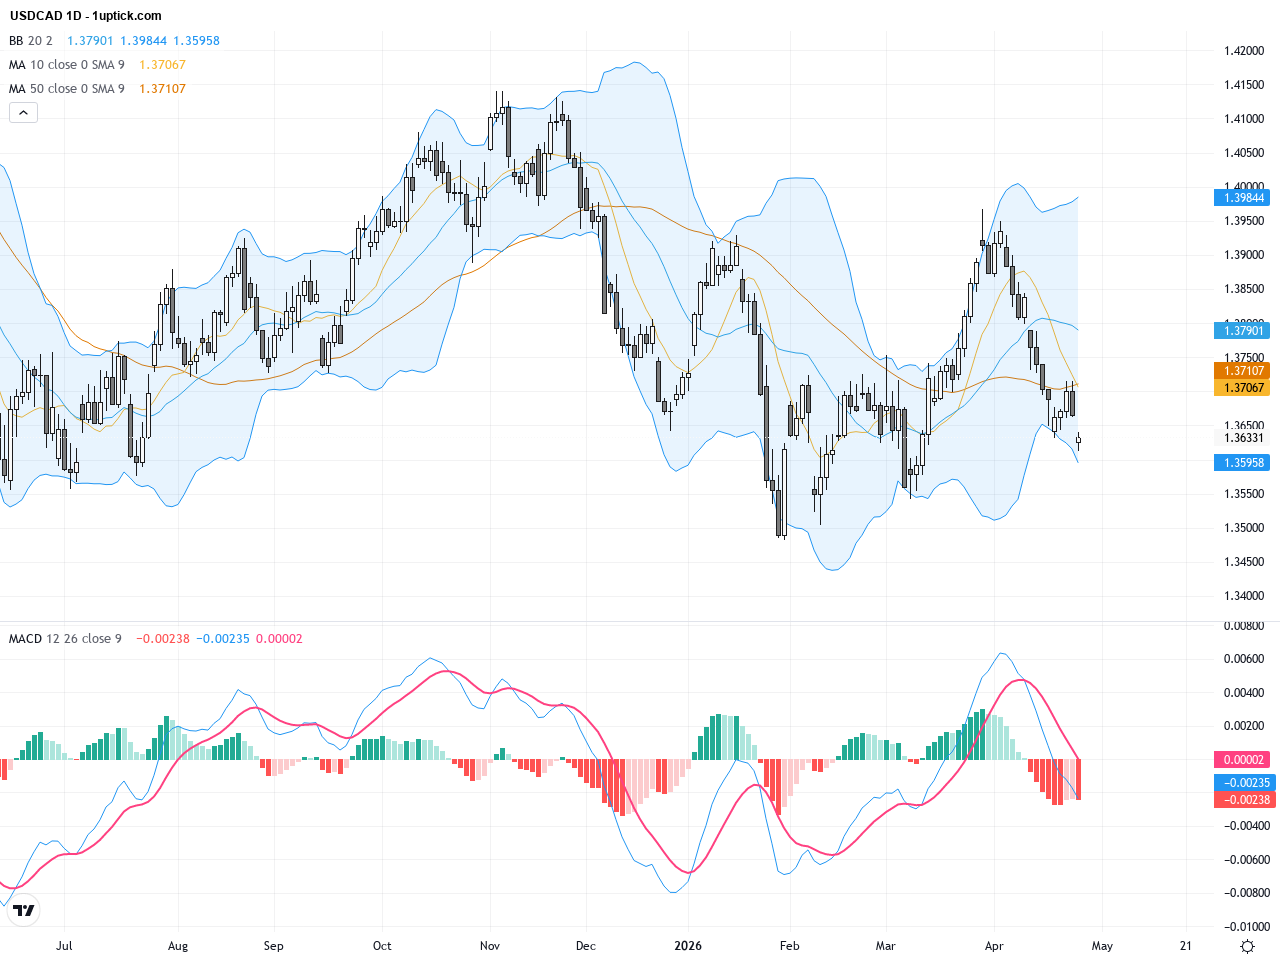
The USDCAD daily chart illustrates a clear downtrend starting from early April near the 1.40 range, with prices recently breaking below both the 50-day and 200-day moving averages, signaling a shift from bullish to bearish momentum. Bollinger Bands show contraction but with price near the lower band, suggesting sustained downward pressure. The MACD exhibits a bearish crossover with increasing red histogram bars, confirming strong selling momentum over the longer term. The chart supports a continued cautious stance, awaiting confirmation of support levels.
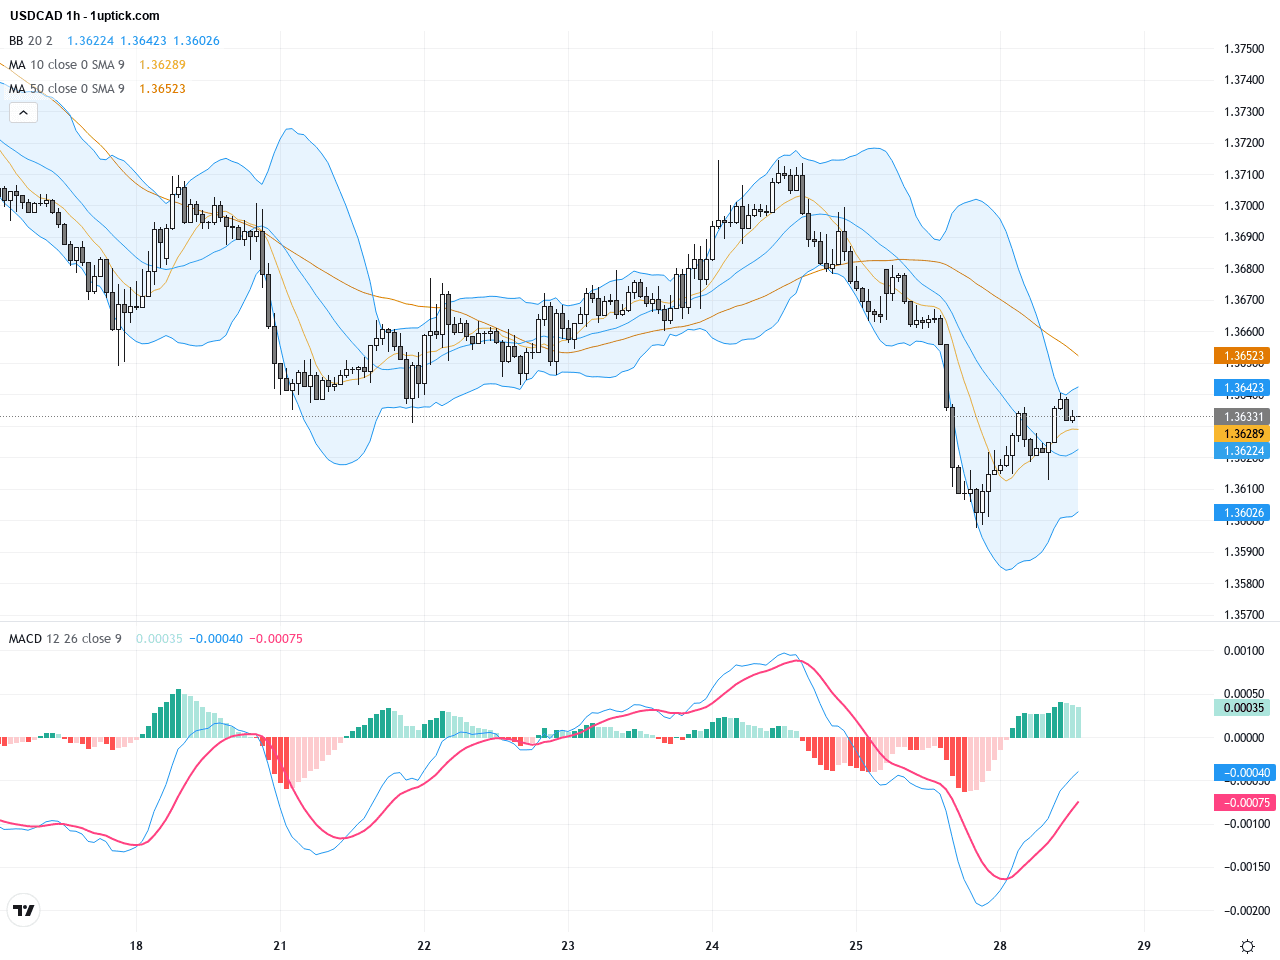
On the hourly chart, USDCAD has experienced heightened volatility over the last 3-5 days, fluctuating within the 1.363 to 1.368 range. The pair repeatedly tested the 200-hour EMA but failed to secure a breakout, marking the line as resistance. Bollinger Bands expansion indicates increased short-term volatility. Recently, a bearish engulfing candlestick pattern emerged, signaling likely continuation of the downward move in the next 24 hours. MACD momentum is fading as histogram bars compress, pointing to a market awaiting decisive direction.
Technical Trend: Currently, the trend is cautiously bearish, with the pair in a defined downward channel. While bears are dominant, potential short-term rebounds exist if key technical supports hold.
Technically, USDCAD is approaching a crucial support level at 1.3600. A breakdown below this could trigger further downside momentum. Recent bearish MACD cross and the formation of a bearish engulfing candle reinforce short-term selling bias. However, holding above the 200-hour EMA might present a short-term bounce opportunity. Volume remains subdued, suggesting indecision. Traders should await volume-confirmed breakouts or rebounds for high-probability setups.Today’s economic calendar reveals some key data releases from Japan including unemployment and the Bank of Japan rate decision, yet these are unlikely to directly impact USDCAD significantly. No major US or Canada data is scheduled that would influence this pair today. Market attention remains focused on upcoming US inflation and Canadian employment data set for later this week, which are likely to drive next directional moves. For now, traders should monitor policy statements carefully.
Resistance & Support

The above financial market data, quotes, charts, statistics, exchange rates, news, research, analysis, buy or sell ratings, financial education, and other information are for reference only. Before making any trades based on this information, you should consult independent professional advice to verify pricing data or obtain more detailed market information. 1uptick.com should not be regarded as soliciting any subscriber or visitor to execute any trade. You are solely responsible for all of your own trading decisions.