




 |
| Gold V.1.3.1 signal Telegram Channel (English) |

USDJPY: Reclaims 159 but RSI Divergence Signals Potential Reversal
2026-04-17 @ 11:01
Over the past 24 to 48 hours, the USD/JPY pair has maintained its strength, trading around 159.35 during Asian sessions, up from yesterday’s close at 159.117. The market volatility has been primarily driven by uncertainty in the Middle East, leading to a softer Japanese yen and extending the rally in USD/JPY. Finance Minister Satsuki Katayama’s statements regarding possible FX intervention heightened market caution and risk sentiment.
Meanwhile, solid US economic data and hawkish comments from Federal Reserve official Williams have supported the dollar’s momentum. The dollar index bounced back from a six-week low, although RSI divergence has capped USD/JPY’s upside potential in the short term.
For average investors, this market behavior reflects capital moving toward safe-haven assets like the US dollar amid geopolitical tensions, aiming to reduce portfolio volatility. However, uncertainty around Japan’s policy stance—highlighted by the IMF’s advice for gradual tightening—suggests ongoing pressure on the yen. Investors should monitor monetary policy developments and regional risks closely to navigate upcoming market fluctuations.

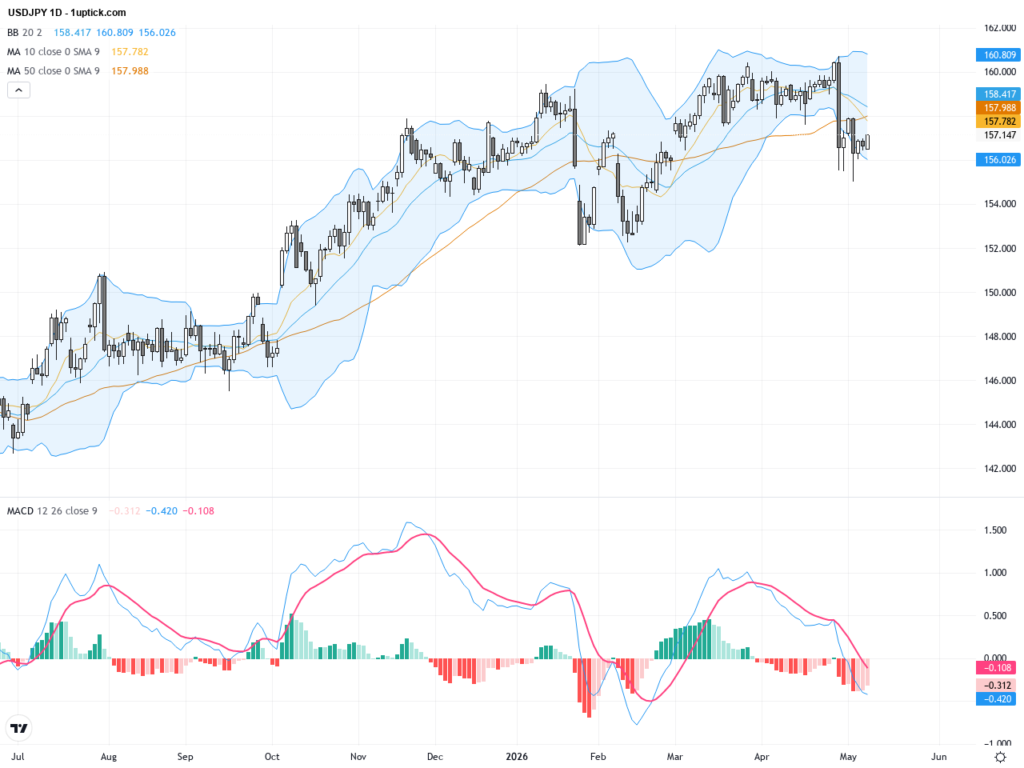
The daily chart shows a strong uptrend with USDJPY having broken and held above its 50-day (around 157.5) and 200-day (around 153.3) moving averages, confirming medium-term bullishness. Bollinger Bands are widening, indicating increased volatility, with price near the upper band suggesting possible near-term pullback. The MACD remains above zero confirming bullish momentum, but an RSI divergence warns of weakening buying strength, signaling potential trend exhaustion.
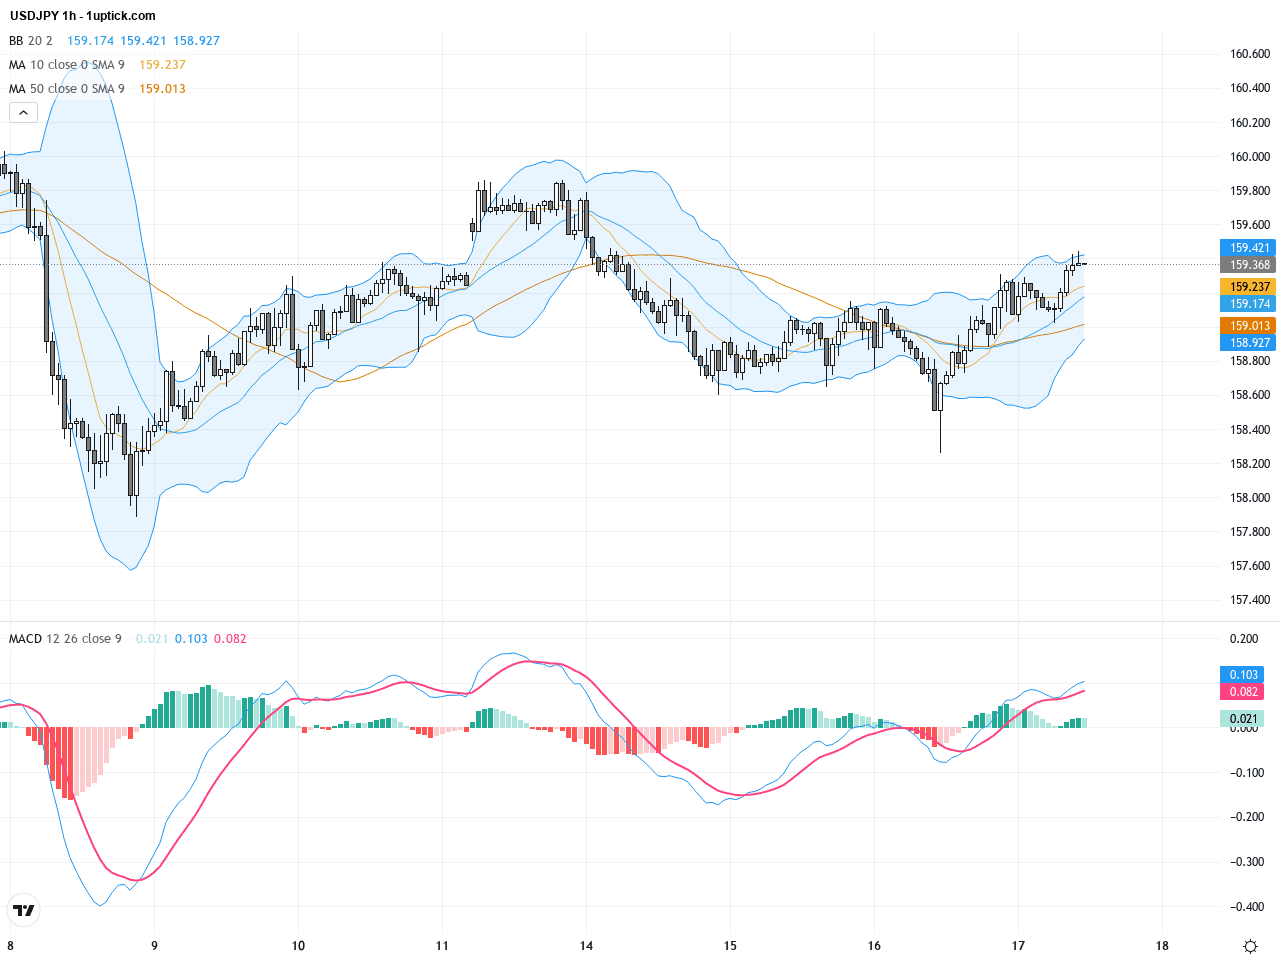
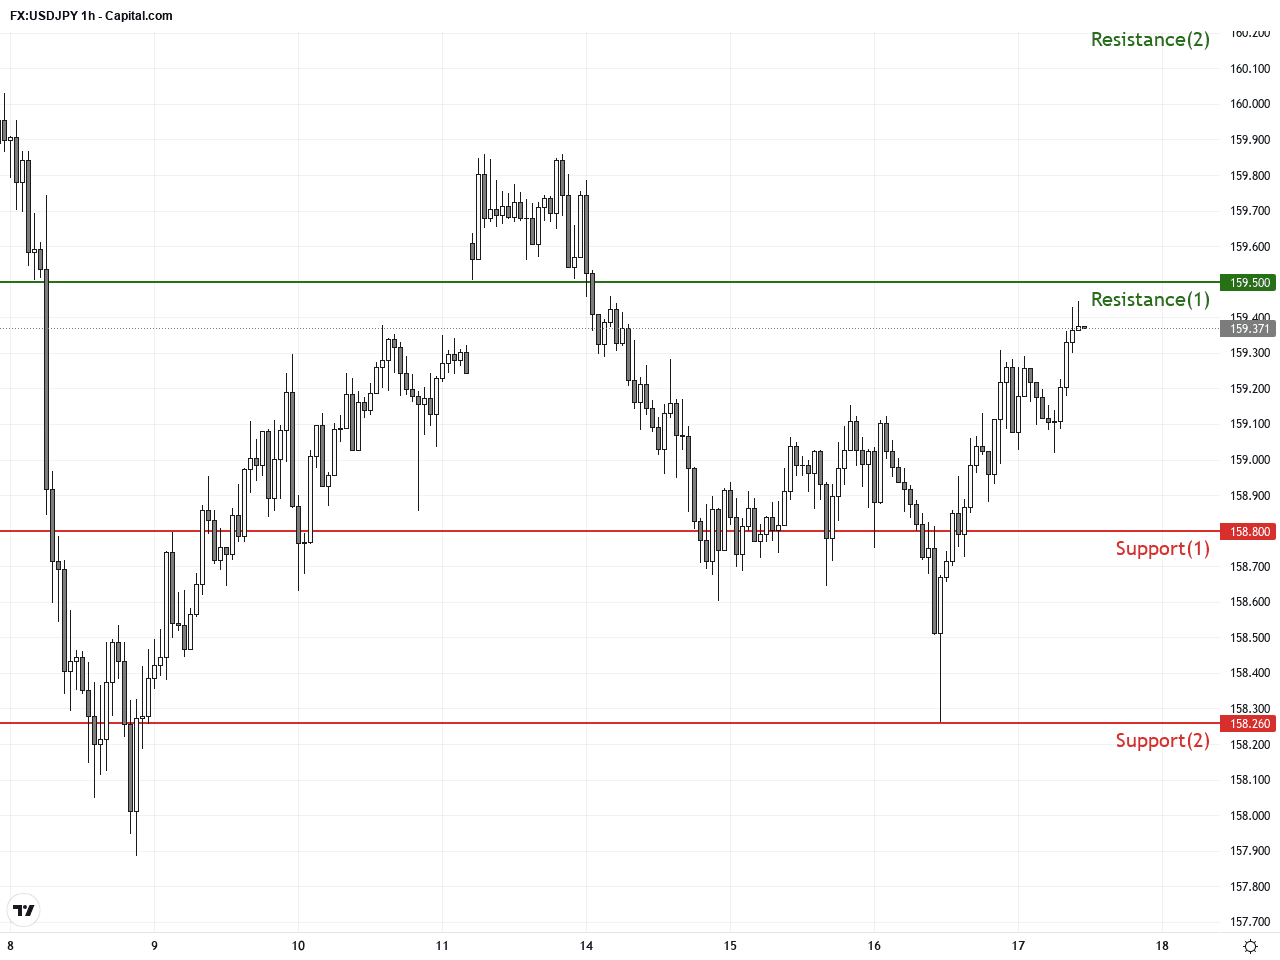
The hourly chart over the past 3-5 days displays a consolidation with a slightly upward bias. Despite minor pullbacks, price has rebounded quickly to the 159 zone. Short-term moving averages (10 & 20 periods) maintain a bullish formation with price above them. Price respects the Bollinger Band middle line as support while MACD histogram shows slowing momentum but no clear bearish crossover yet, suggesting momentum may continue in the short term.
Technical Trend: USDJPY is in a cautiously bullish consolidation phase with the overall bias favoring further gains, but short-term correction risk remains present.
Technically, 159.00 acts as key resistance, but the RSI divergence signals potential near-term selling pressure. A bullish flag pattern may be forming on the daily chart, with a breakout above the upper boundary likely to propel further gains. The 60-minute chart shows momentum remains supportive. Traders should monitor volume closely; sustained buying volume is essential for confirming an upside continuation.Today’s economic calendar features no major US or Japanese data directly impacting USDJPY. European trade balances and current accounts are being released but have limited influence on the pair. Attention should be paid to late US FOMC officials’ speeches, which might create some volatility for the dollar but are unlikely to change USDJPY’s immediate direction significantly.
Resistance & Support
The above financial market data, quotes, charts, statistics, exchange rates, news, research, analysis, buy or sell ratings, financial education, and other information are for reference only. Before making any trades based on this information, you should consult independent professional advice to verify pricing data or obtain more detailed market information. 1uptick.com should not be regarded as soliciting any subscriber or visitor to execute any trade. You are solely responsible for all of your own trading decisions.