

 |
| Gold V.1.3.1 signal Telegram Channel (English) |
WTI Crude Oil Faces Key Support Test Amid Technical Signs of Volatility
2026-04-02 @ 06:03
Over the past 24 to 48 hours, the WTI crude oil market has experienced notable volatility and a pullback, closing yesterday at $100.12 per barrel, slightly down from the previous day’s $101.38. The energy market was influenced by a mix of Middle East geopolitical developments and supply data, creating a cautiously optimistic mood among investors.
Market focus recently centered on the easing tensions between Iran and the U.S., particularly signals that the Iran conflict could end within weeks. This sentiment boosted stock markets while putting downward pressure on oil prices as expectations of reduced crisis escalation lowered anticipated demand and prices. Meanwhile, uncertainty around the Strait of Hormuz continues, leading prices to hover around the $100 mark, with the market balancing between hope for peace and caution over lingering risks.
Additionally, the U.S. Department of Energy reported a rise in crude inventories by 5.5 million barrels, with stockpiles slightly above the five-year average for this period. This supply-side easing has further pressured oil prices. Investors are seeking stability amid this pullback, closely watching actual energy supply trends and geopolitical developments.
For the average investor, this recent price fluctuation can be seen as a natural market adjustment as the industry processes geopolitical news and inventory data. While prices have dipped, the overall supply-demand fundamentals and Middle East uncertainties continue to support crude values. It’s advisable for investors to stay alert to ongoing geopolitical updates and U.S. inventory reports to capture potential new market trends.

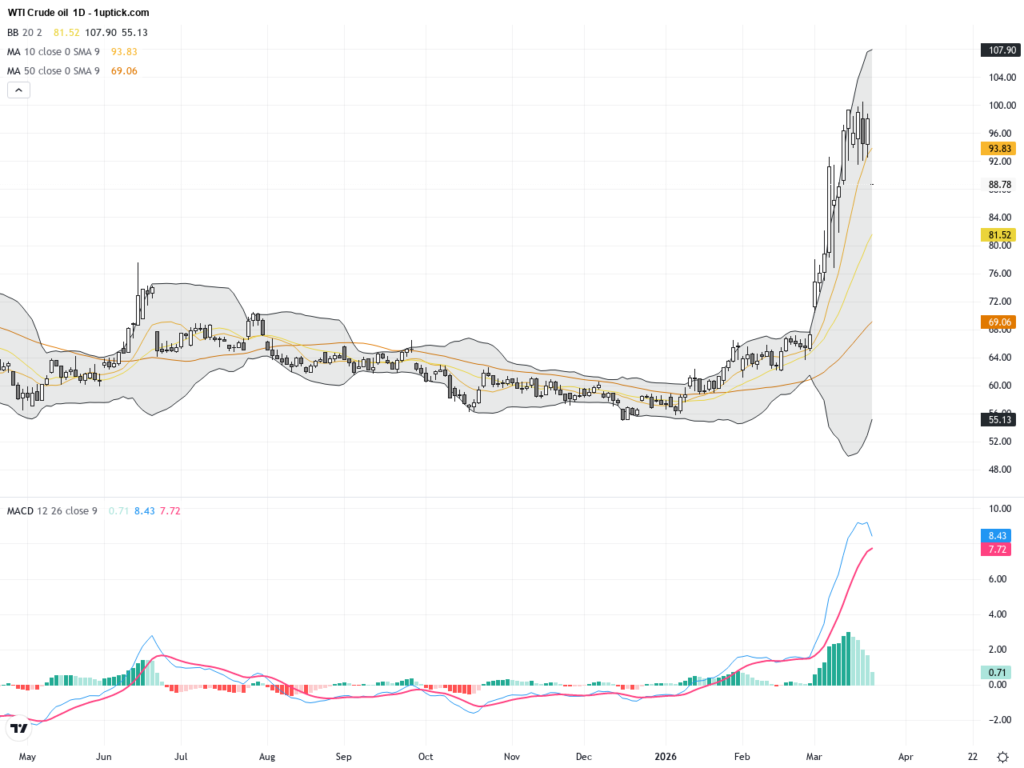
The daily chart shows a clear downtrend forming since the late March peak above $106. Prices have entered a consolidation phase over the last three days, with moving averages converging and Bollinger Bands narrowing, indicating reduced volatility. The MACD indicator is nearing a bearish crossover, suggesting strengthening downside momentum and a technical environment favoring a corrective phase.

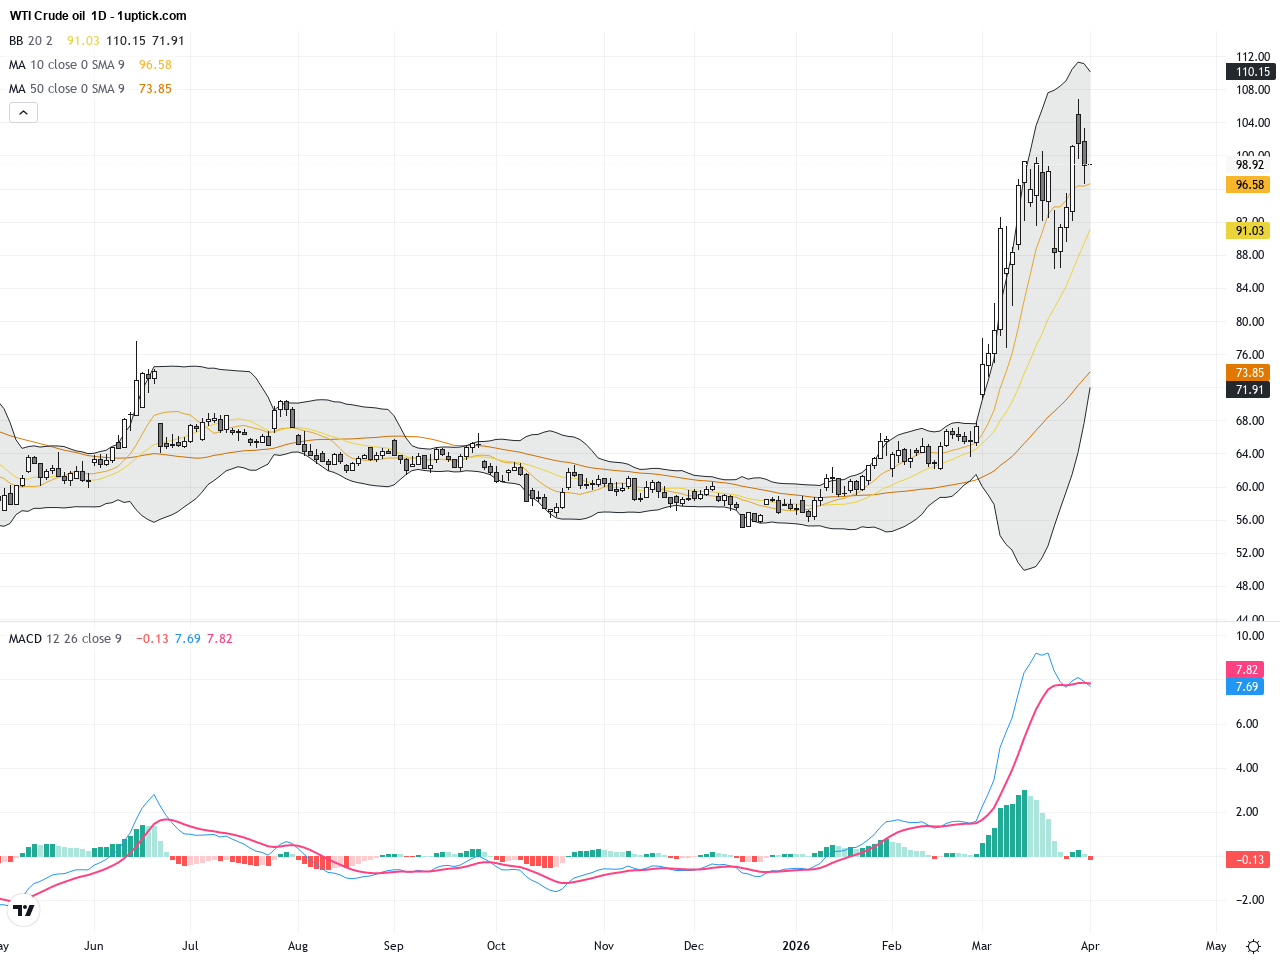
The hourly chart over the past 3-5 days highlights heightened price fluctuations between $97 and $103, with multiple tests of support and resistance levels. Short-term moving averages have recently crossed, and the MACD shows bearish divergence. The $100 psychological resistance holds firm, suggesting near-term downside risk, though support around $97 may offer temporary relief.
Technical Trend: Short-term trend is cautiously bearish with a corrective tone and increased volatility in play.
Technically, WTI is at a pivotal juncture, with a potential MACD bearish crossover looming. A break below the $97 support level could accelerate the short-term downtrend. Intraday focus should remain on whether the $100 resistance is breached, with volume patterns critical for confirming trading signals. The current technical setup favors cautious short positions on rallies amid consolidation with bearish bias.There are no significant economic events today that will directly impact WTI crude oil prices. Market participants should continue monitoring geopolitical developments and U.S. Energy Department inventory releases, which remain key drivers for oil price movements in the near term.
Resistance & Support

The above financial market data, quotes, charts, statistics, exchange rates, news, research, analysis, buy or sell ratings, financial education, and other information are for reference only. Before making any trades based on this information, you should consult independent professional advice to verify pricing data or obtain more detailed market information. 1uptick.com should not be regarded as soliciting any subscriber or visitor to execute any trade. You are solely responsible for all of your own trading decisions.