


 |
| Gold V.1.3.1 signal Telegram Channel (English) |

WTI Crude Oil: Geopolitical Tensions Spark Technical Breakout, Price Eyes Key Resistances
2026-04-23 @ 06:03
Over the past 24 to 48 hours, the WTI crude oil market experienced notable volatility and price gains. The closing price on April 22 stood at $92.96, up slightly from $92.13 the day before, reflecting growing concerns about tightening oil supply. The market’s attention has been focused on conflict in the Persian Gulf and the blockade of the Strait of Hormuz, particularly Iran’s refusal to reopen the strategic passage, which disrupts a major oil transit route and strains global oil supplies.
This situation has pushed Asian buyers to turn to U.S. crude, rerouted via the Panama Canal, positioning WTI as a global safe-haven asset and providing strong price support. From an everyday investor’s standpoint, when key oil sources face geopolitical disruptions limiting exports, global supply tightens and prices naturally rise. At the same time, the U.S. benefits from higher oil prices, further attracting market funds to American crude and improving its market dominance and profit potential.
In summary, the latest market news highlights that the Iran conflict and U.S. naval blockade are the main drivers behind the recent WTI crude price increase. For investors tracking the oil market, closely following developments in Middle Eastern geopolitics and U.S. strategic moves will be critical for anticipating price trends.

The daily chart shows WTI crude climbing steadily over the past week from approximately $83, breaking above key moving averages including the 20-day and 50-day MAs, signaling a confirmed medium-term uptrend. Bollinger Bands expansion points to increasing volatility, while the MACD remains above zero, supporting bullish momentum. Recent price action testing resistance around $92-$94 suggests buyers retain control with potential for further gains. The technical structure implies continued upward pressure on price in the near term.
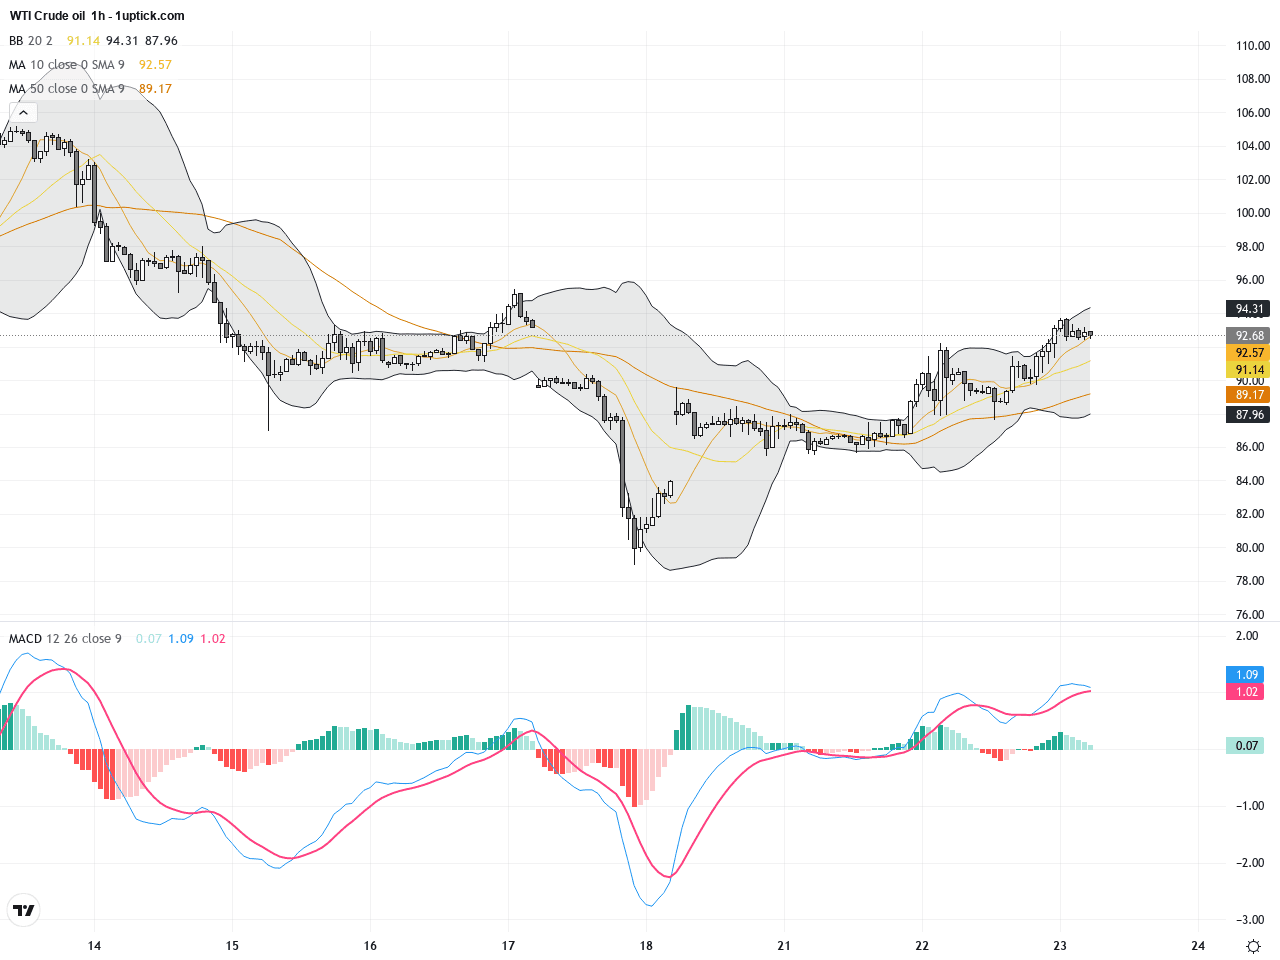
On the 4-hour chart, WTI has shown a steady rebound over the last 3 to 5 days, oscillating between $90 and $93. Short-term moving averages (10 and 20 periods) have crossed multiple times, indicating some short-term indecision. The Bollinger Band middle line acts as immediate support, and the MACD’s fast line is attempting a bullish crossover. A recent bullish engulfing candlestick signals a positive outlook for the next 24 hours, providing short-term traders with a potential entry point.
Technical Trend: WTI Crude Oil is currently in a cautiously bullish trend, showing clear upward momentum tempered by short-term consolidation and pullbacks, reflecting a steady but volatile advance.
Key technical insight is the potential MACD golden cross on the daily chart, suggesting strengthening upward momentum. The Bollinger Bands are widening, reflecting higher volatility, while the hourly chart’s bullish engulfing candle offers a short-term buy signal. Overall, the market shows cautious optimism with trading volume yet to spike significantly, indicating room for further moves based on news flow. This environment presents high-probability trading opportunities amid ongoing supply concerns.There are no significant or directly relevant economic data releases impacting WTI Crude Oil today. Given the 7-hour time difference between Hong Kong (HKT) and the GMT+1 economic calendar, oil market movements are expected to respond more to geopolitical developments than scheduled economic events. Traders should stay alert to news on Middle East issues and logistical changes affecting supply routes for immediate price impacts.
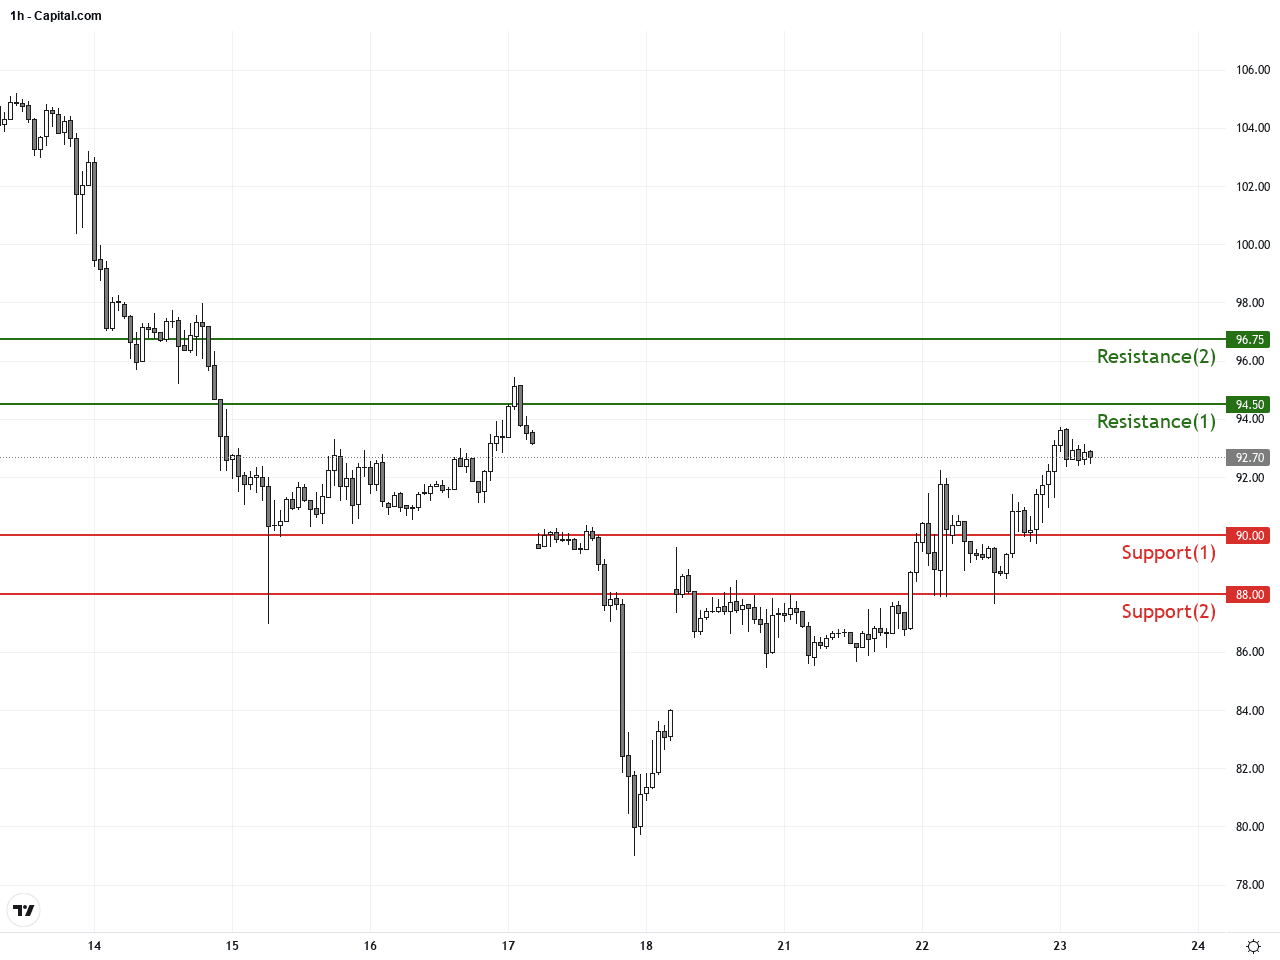
Resistance & Support
The above financial market data, quotes, charts, statistics, exchange rates, news, research, analysis, buy or sell ratings, financial education, and other information are for reference only. Before making any trades based on this information, you should consult independent professional advice to verify pricing data or obtain more detailed market information. 1uptick.com should not be regarded as soliciting any subscriber or visitor to execute any trade. You are solely responsible for all of your own trading decisions.