



 |
| Gold V.1.3.1 signal Telegram Channel (English) |

WTI Crude Oil: Key Triangle Pattern Forms Amid Trading Outlook Uncertainty
2026-04-21 @ 06:03
Over the past 24 to 48 hours, WTI Crude Oil prices have experienced notable volatility, closing at $87.42 on April 20, showing a slight increase from the previous day. The market was primarily driven by escalating US-Iran tensions, especially with President Trump hinting at ending the Iran ceasefire, which sent oil prices surging and triggered heightened risk-off sentiment.
However, reports that Iran kept the Strait of Hormuz open eased supply disruption fears, causing crude futures to plunge and turn bearish, reflecting the market’s short-term relief on geopolitical risks. This sharp rise and fall illustrate how sensitive the WTI oil market remains amid geopolitical uncertainties.
For the average investor, this means that energy prices remain highly reactive to sudden diplomatic events, resulting in swift price swings. Staying informed on Middle East developments and diplomatic talks is crucial, as these factors directly influence oil price trends and overall market risk appetite, impacting investment portfolio performance.
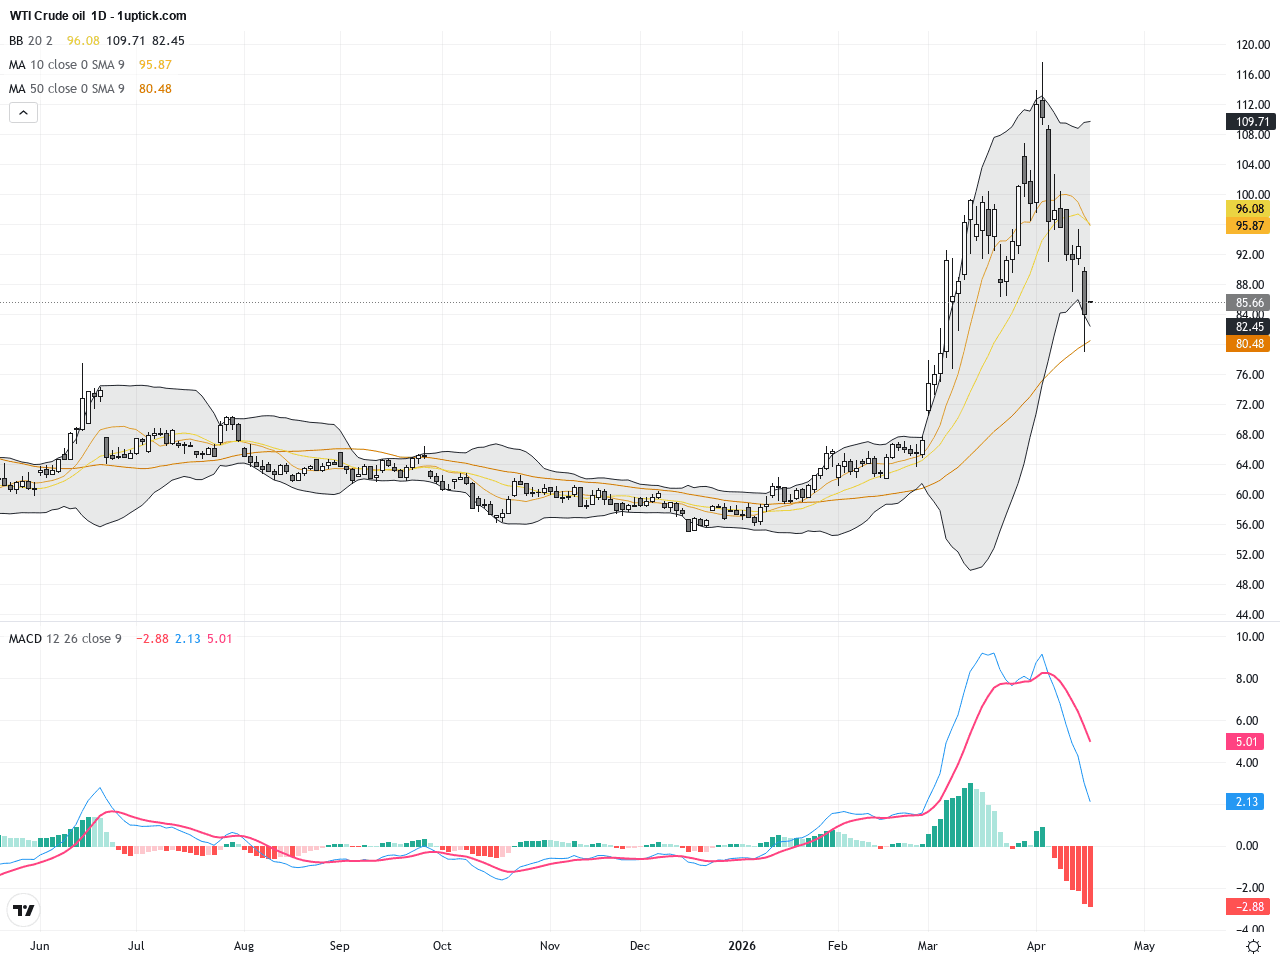
The WTI Crude Oil daily chart illustrates a gradual pullback from recent highs toward the $87 range, forming a clear triangle consolidation pattern starting mid-April. Moving averages indicate a short-term bearish bias as shorter MAs sit below longer ones. Bollinger Bands are contracting, signaling reduced volatility and sideways price action. The MACD remains below zero but oscillating, reflecting market indecision and cautious positioning.
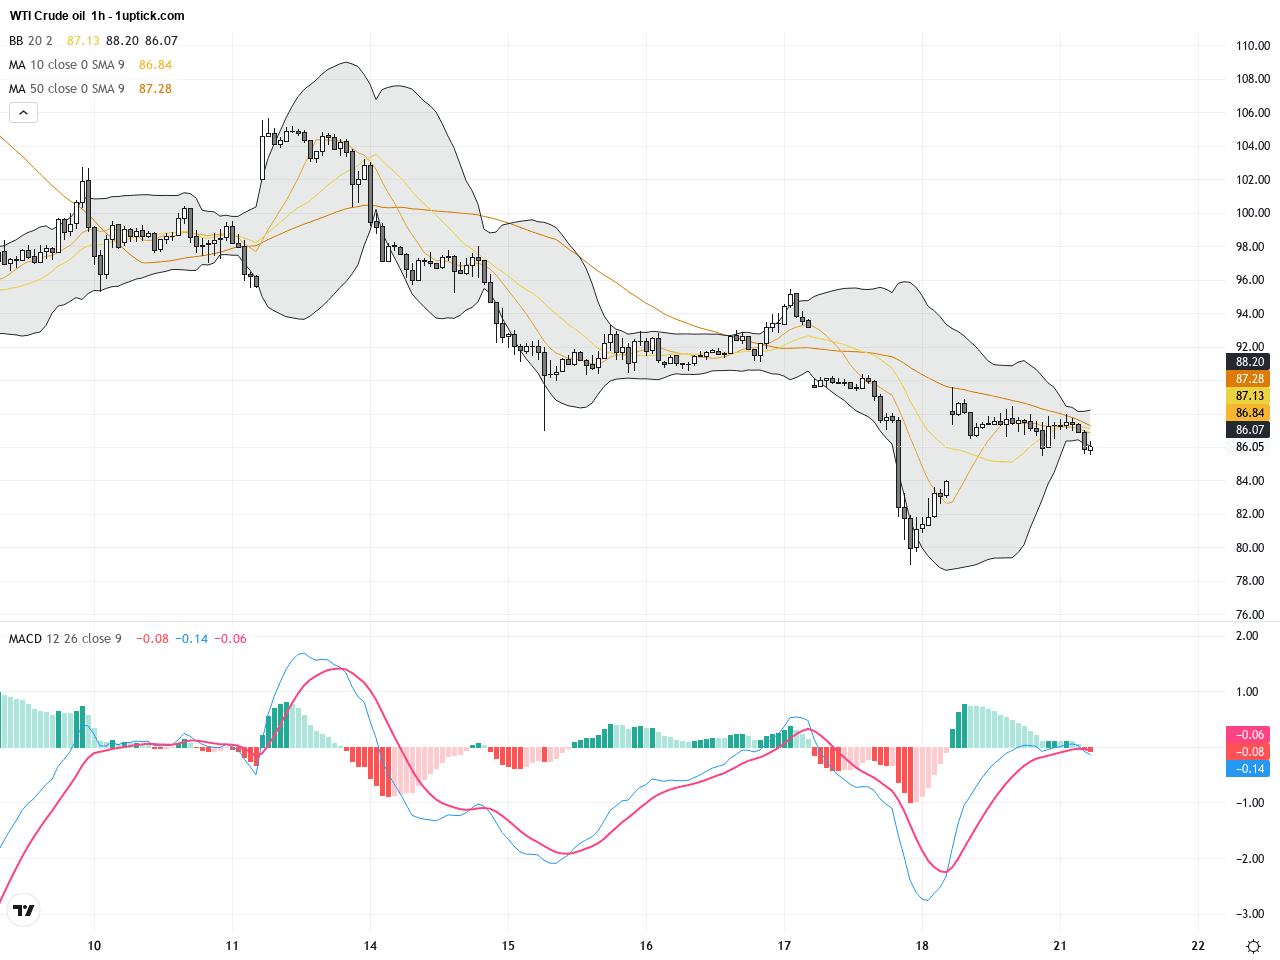
The hourly chart over the past 3-5 days reflects significant intraday oscillations between $85 and $89. Short-term moving averages frequently cross, highlighting high volatility. MACD shows a slight bullish divergence, coupled with a recent kicker candlestick pattern after a strong bullish candlestick, suggesting an attempted short-term uptrend rebound, though the broader momentum remains uncertain.
Technical Trend: At present, the market is cautiously consolidating, with traders maintaining a watchful stance. However, as the triangle pattern nears its apex, a breakout seems imminent, requiring readiness to adapt to rapid trend shifts.
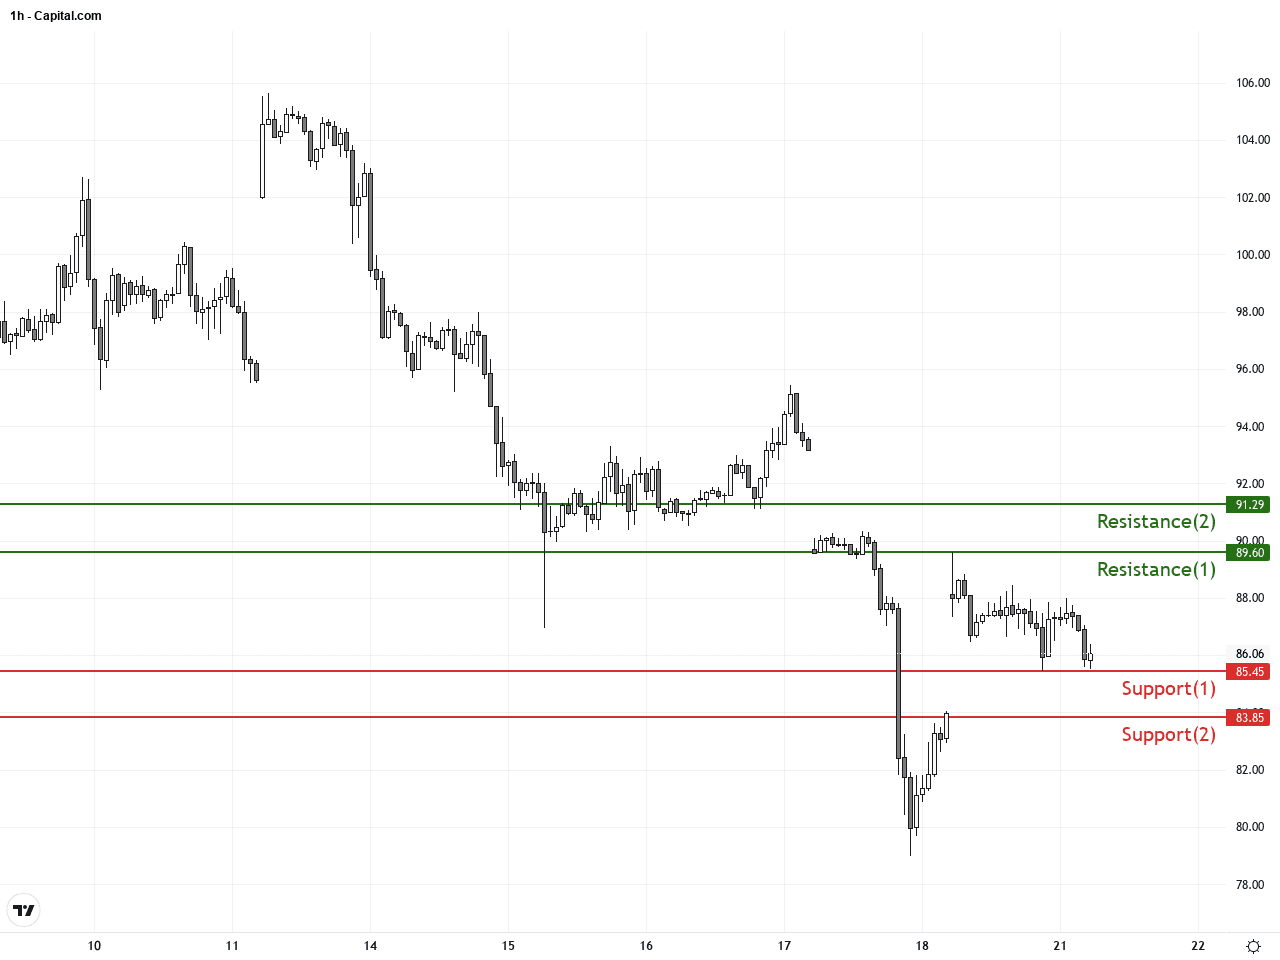
WTI Crude Oil currently forms a triangle consolidation pattern, often a precursor to a trend breakout. Daily MACD hovers near zero, reflecting balanced bullish and bearish forces. On the hourly chart, MACD divergence combined with a kicker candlestick signals a possible short-term bullish recovery. Watch closely for volume and momentum shifts upon a breakout above resistance at $89.60 or a breakdown below support at $85.45, as this will define the next major trading move.There are no significant or directly relevant economic events scheduled today that will impact WTI Crude Oil prices. Market focus remains on geopolitical tensions and supply risk developments, with attention recommended on upcoming inventory data and US economic releases in subsequent days.
Resistance & Support
The above financial market data, quotes, charts, statistics, exchange rates, news, research, analysis, buy or sell ratings, financial education, and other information are for reference only. Before making any trades based on this information, you should consult independent professional advice to verify pricing data or obtain more detailed market information. 1uptick.com should not be regarded as soliciting any subscriber or visitor to execute any trade. You are solely responsible for all of your own trading decisions.