


 |
| Gold V.1.3.1 signal Telegram Channel (English) |

XAUUSD: Gold Pullback Amid Profit-Taking Tests Key Support Levels
2026-04-16 @ 05:04
Over the past 24 to 48 hours, gold (XAUUSD) experienced notable price volatility, closing yesterday at $4789.115, down from the previous day’s $4841.76. This pullback was primarily driven by investor profit-taking, as highlighted in recent market news indicating a short-term correction amid gains.
Meanwhile, a weakening US dollar and crude oil prices falling below $100 per barrel provided some support for gold. Optimism over renewed US-Iran talks further boosted safe-haven demand. However, ongoing geopolitical tensions have somewhat diluted gold’s traditional safe-haven status, with the metal exhibiting characteristics more akin to a high-beta asset. For investors, the recent gold market has been a balancing act between risk and opportunity, reflecting the significant impact of global economic and political uncertainties.

The daily chart shows XAUUSD climbing from a recent low near $4,640 over the past seven days, hitting the $4,850 range before pulling back recently. Moving averages indicate a bullish setup with short-term MA above long-term MA, though nearing a consolidation phase. The Bollinger Bands are widening with price testing resistance near the upper band. MACD remains positive with no death cross yet, implying the uptrend base is intact but momentum is slowing. Overall, the daily trend remains bullish with caution warranted around current pullbacks.
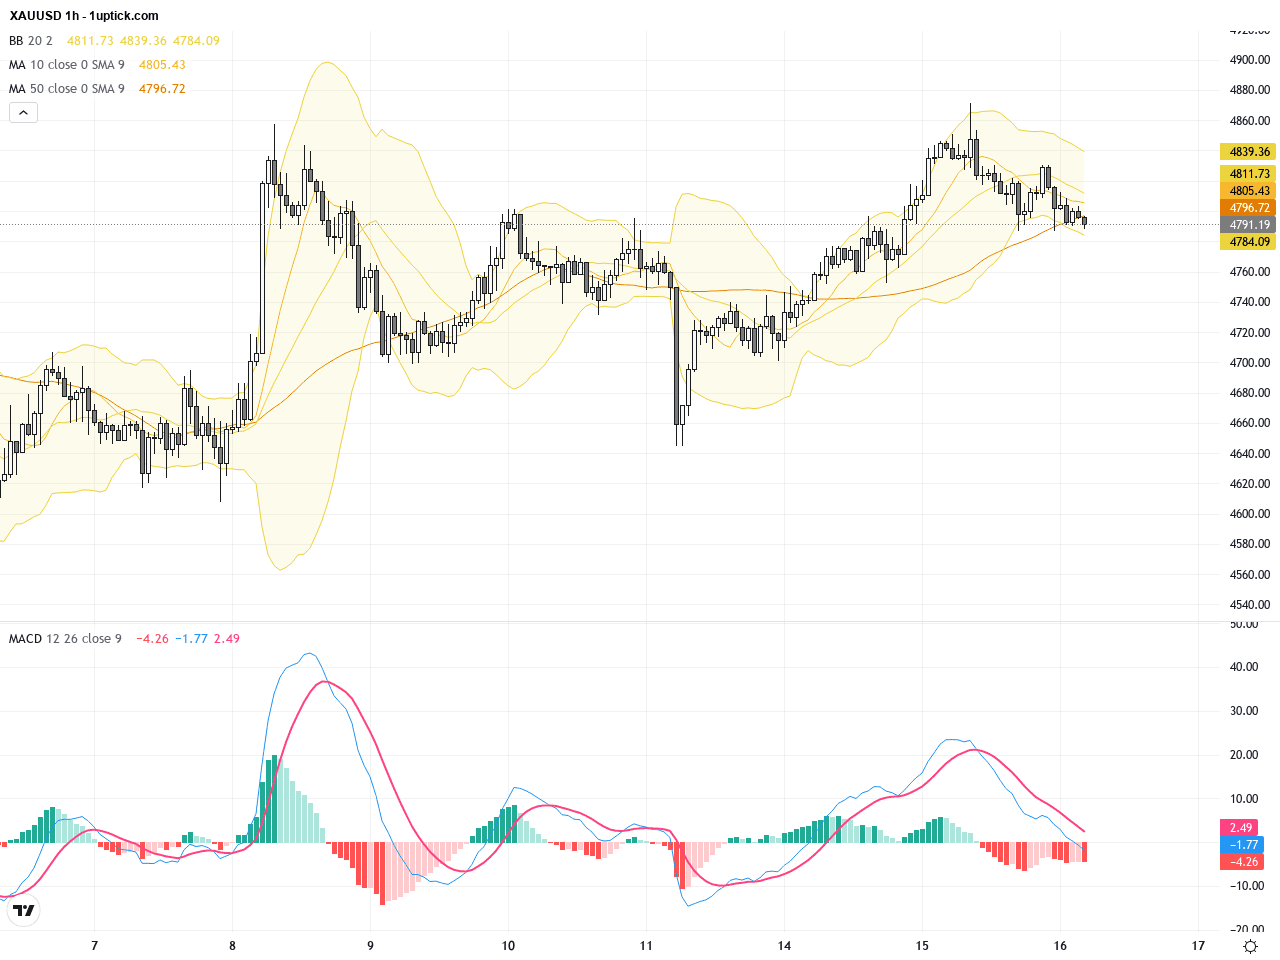
The hourly chart reveals XAUUSD has experienced a corrective downtrend over the last 3-5 days, dipping from highs near $4,870 to about $4,780. Price repeatedly tested 20-period moving average support with the Bollinger middle band holding firm. MACD shows mild bearish divergence and recent candle patterns include a bearish engulfing, signaling potential downside risk in the next 24 hours if support fails. Holding above $4,780 could enable bounce-back opportunities.
Technical Trend: Cautiously consolidating
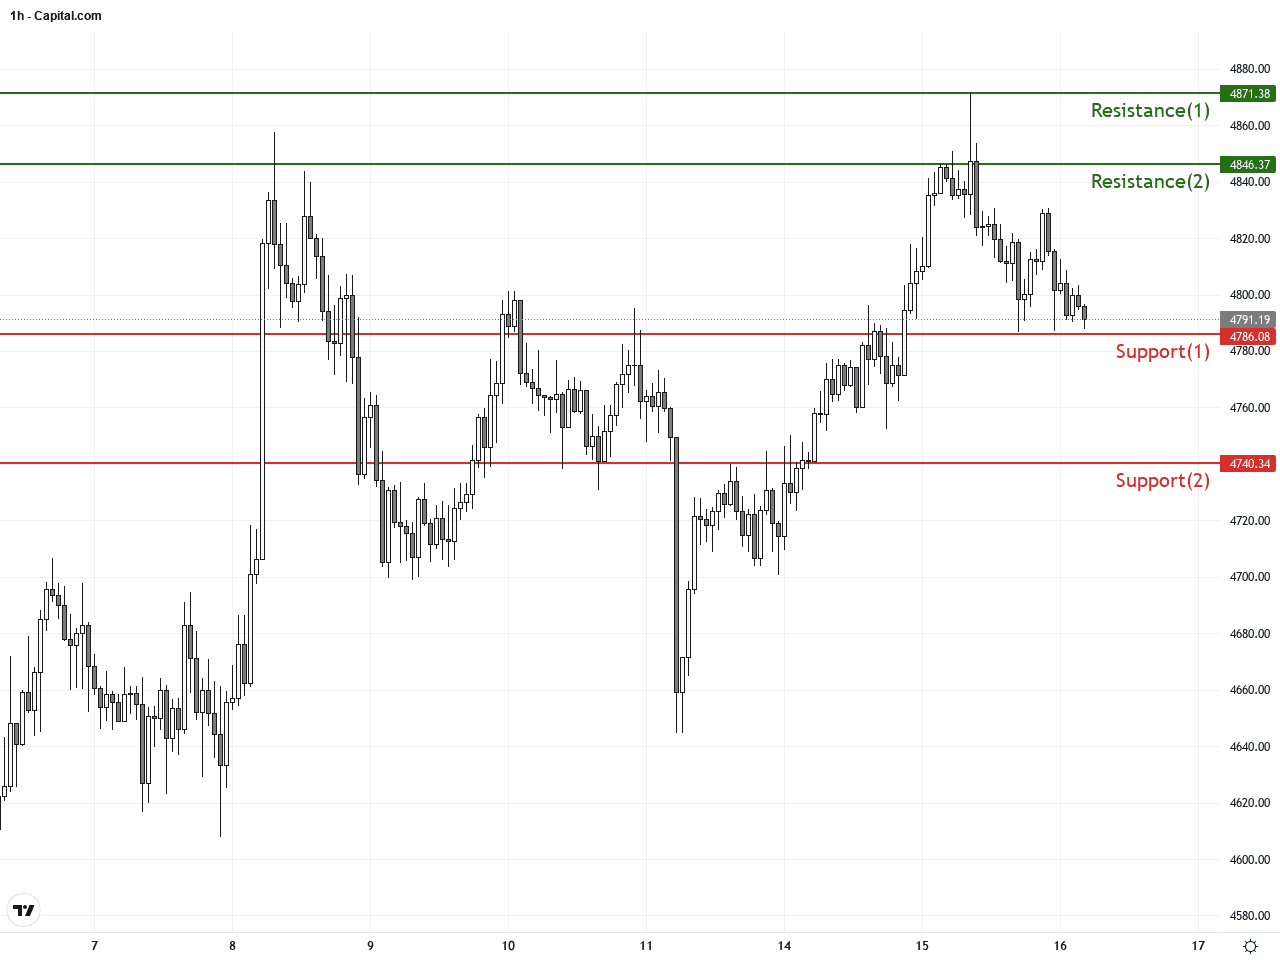
Technically, XAUUSD trades within a short-term pressure zone on the daily chart with slowing momentum per MACD, and the 20-period MA acting as a critical support. The upper Bollinger band shows resistance, while the hourly bearish engulfing suggests ongoing short-term selling pressure. A break below $4,780 support might trigger further downside, but sustained support could set up a rebound. Traders should prepare for volatile swings and focus on immediate support and resistance levels.Today’s economic calendar shows no major events directly affecting XAUUSD. Japan’s February machinery orders came in better-than-expected, slightly supportive for risk sentiment but limited impact on gold. Key US releases include export prices and the NY Empire State manufacturing index, which may cause dollar fluctuations and concurrently impact gold prices. No significant Fed speeches are scheduled, rendering the overall calendar neutral for gold trading today.
Resistance & Support
The above financial market data, quotes, charts, statistics, exchange rates, news, research, analysis, buy or sell ratings, financial education, and other information are for reference only. Before making any trades based on this information, you should consult independent professional advice to verify pricing data or obtain more detailed market information. 1uptick.com should not be regarded as soliciting any subscriber or visitor to execute any trade. You are solely responsible for all of your own trading decisions.