


 |
| Gold V.1.3.1 signal Telegram Channel (English) |
XAUUSD: Key Technical Support Under Pressure as Strong Dollar and Oil Surge Weigh on Gold Outlook
2026-04-24 @ 05:04
Over the past 24 to 48 hours, gold (XAUUSD) experienced notable volatility, slipping from yesterday’s closing price of $4,690.92. The precious metal faced downward pressure from a strong US dollar and a spike in oil prices. Rising US 10-year Treasury yields further intensified the upward trajectory of rates, weighing on gold’s appeal as a safe haven, while oil prices climbing above $100 per barrel heightened inflation concerns, dampening gold’s performance.
Specifically, the strong dollar continues to erode gold’s allure, making dollar-based assets more attractive to investors. Meanwhile, easing tensions in the Middle East, despite lingering uncertainty, have lessened gold’s traditional safe-haven demand. Overall, the surge in inflation expectations supported by oil prices, combined with expectations of a “higher-for-longer” interest rate environment, are prompting investors to favor higher-yielding US government bonds, putting pressure on gold prices.
For the average investor, the takeaway is straightforward: rising oil prices have stoked inflation fears, delaying Federal Reserve rate cuts, which in turn is suppressing gold prices. Additionally, a stronger dollar has increased the opportunity cost of holding gold. In other words, even though gold is traditionally seen as a hedge against inflation, the dual impact of rising oil prices and a strong dollar has weighed heavily on gold recently, signaling investors to keep a close eye on global macroeconomic and geopolitical developments.
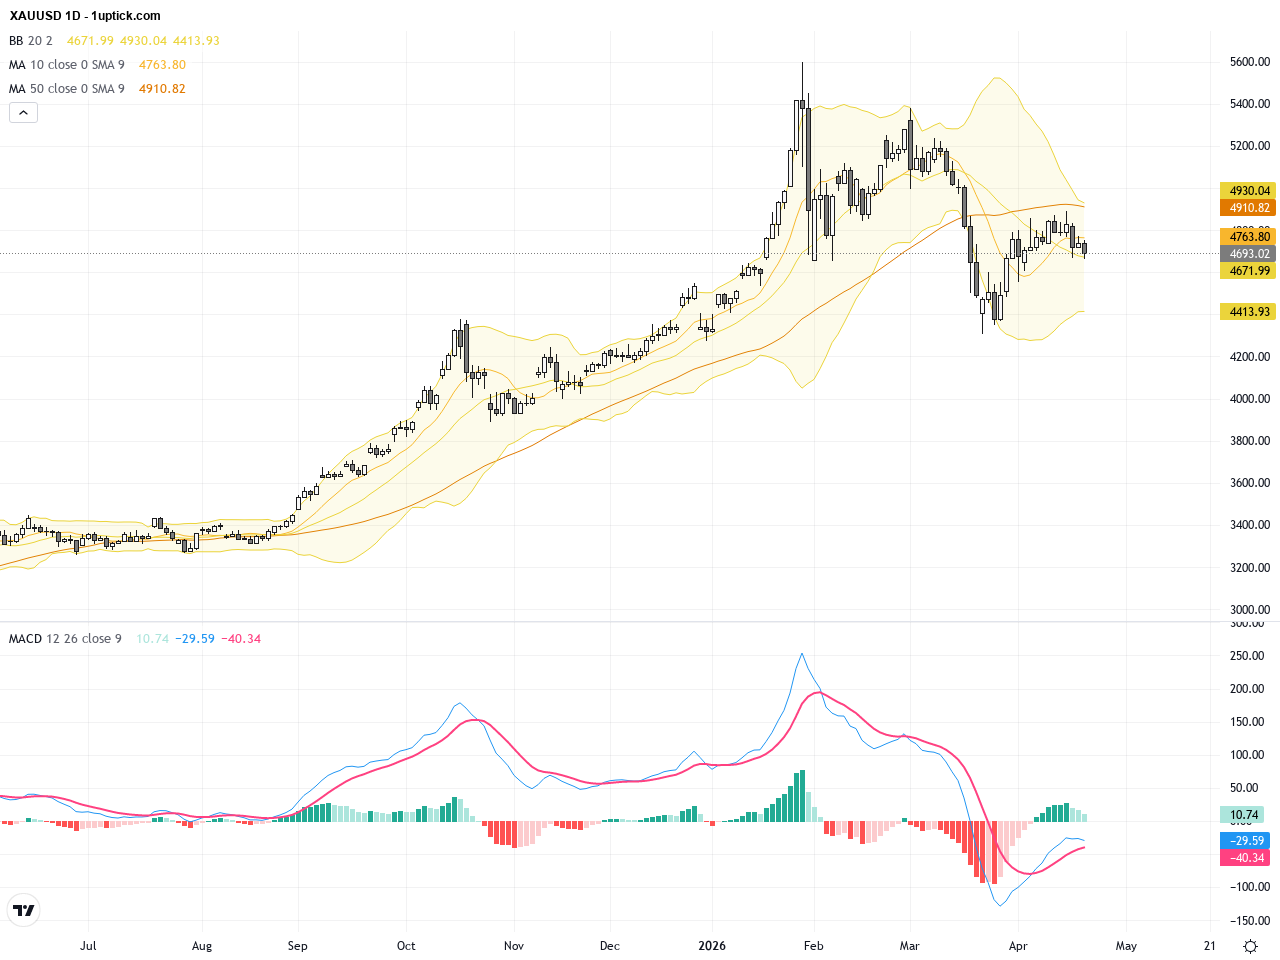
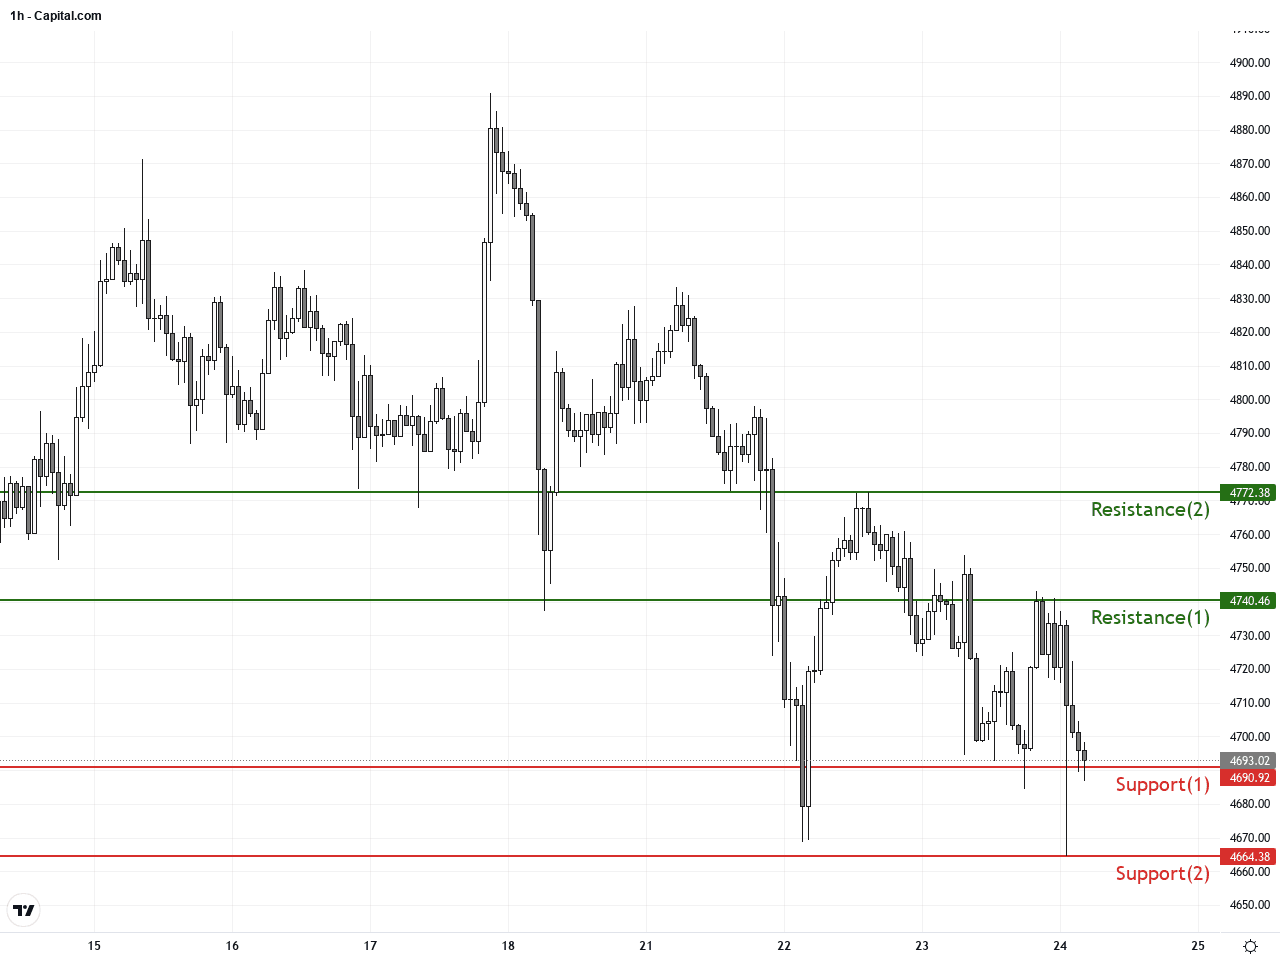
The daily chart shows XAUUSD dropping from recent highs near 4772, breaking below the 50-day moving average (MA) and entering a correction phase. Bollinger Bands are contracting with prices moving downward along the mid-band, indicating reduced volatility but persistent selling pressure. The MACD has formed a bearish crossover, signaling weakening momentum in the medium term. The trend on the daily timeframe favors a cautious bearish stance, with support around 4700 to 4690 being critical. A break below this could open a path to test 4660 or even 4600 levels.
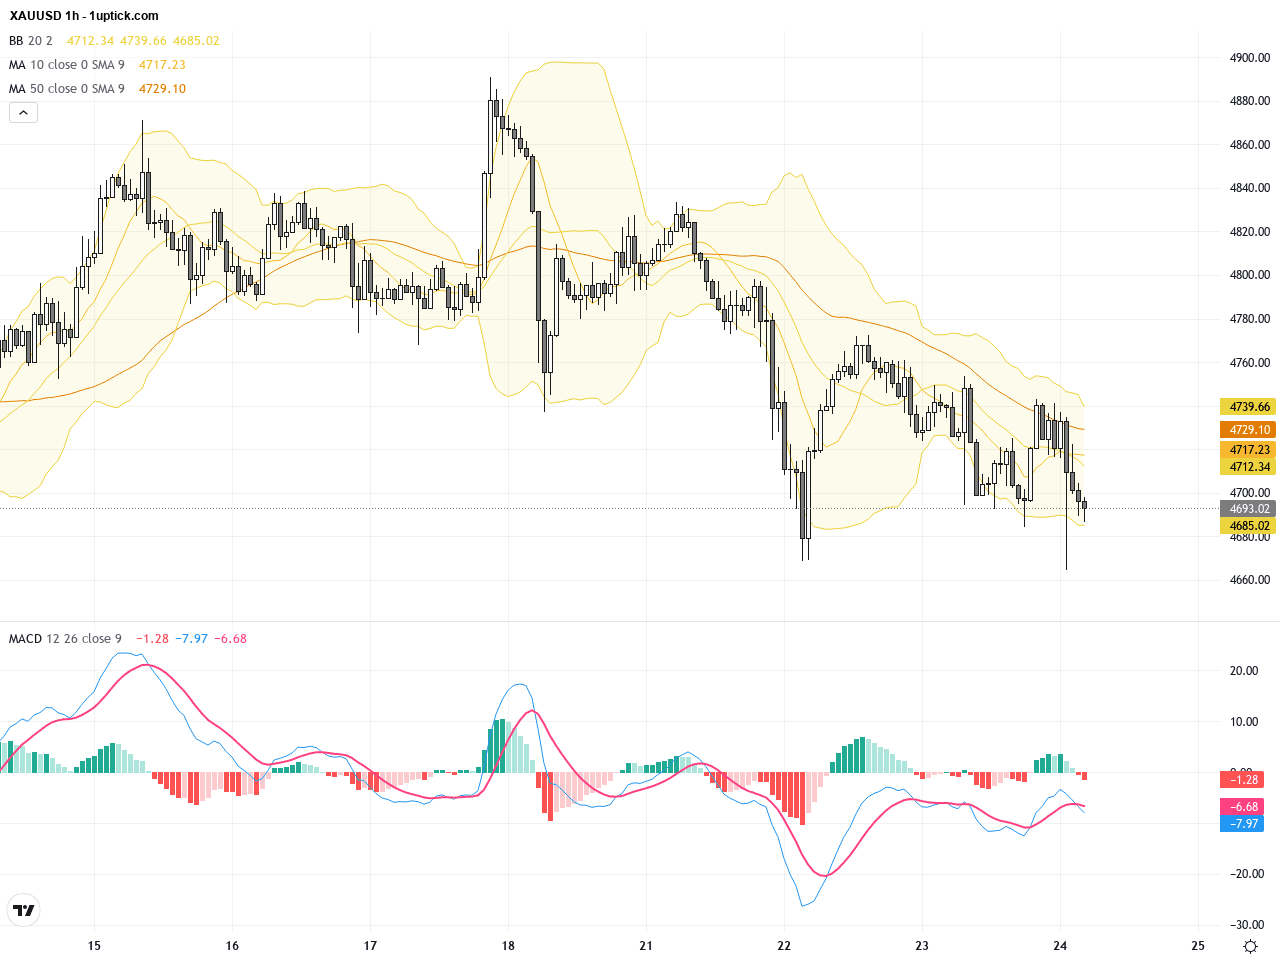
On the hourly chart, the downtrend over the past 3-5 days is more pronounced. Price attempts to rebound have failed to break above the 20-period moving average, which remains overhead resistance. Bollinger Bands are expanding, reflecting increased short-term volatility. The MACD histogram remains negative and RSI is low but not oversold. Recently formed bearish engulfing candlestick suggests further downside risk in the next 24 hours. Short-term traders should watch for bounce strength and manage risk carefully.
Technical Trend: Cautiously Bearish
Technical insights reveal XAUUSD is at a precarious juncture, with MACD bearish crossover and hourly bearish engulfing pattern suggesting continued downside pressure. Volume and volatility indicators confirm that bulls have not reclaimed key moving averages, emphasizing a cautious bearish trading environment. Close attention must be given to whether key support levels hold, as failing to do so could escalate downside momentum.Today’s economic calendar features mainly European and Japanese manufacturing and services PMIs, which are of neutral to mildly bearish impact to XAUUSD. As gold is more sensitive to US dollar strength and interest rate expectations, key US manufacturing and services PMIs along with weekly jobless claims later this week will be more impactful. There is no direct major economic event today expected to decisively move gold prices.
Resistance & Support
The above financial market data, quotes, charts, statistics, exchange rates, news, research, analysis, buy or sell ratings, financial education, and other information are for reference only. Before making any trades based on this information, you should consult independent professional advice to verify pricing data or obtain more detailed market information. 1uptick.com should not be regarded as soliciting any subscriber or visitor to execute any trade. You are solely responsible for all of your own trading decisions.