 |
| Gold V.1.3.1 signal Telegram Channel (English) |
AUDUSD: Critical 0.72 Resistance Tests Amid Fading Momentum, May 4, 2026
2026-05-04 @ 06:01
Over the past 24 to 48 hours, the Australian Dollar against the US Dollar (AUD/USD) has remained around the 0.72 level, slightly rising above yesterday’s closing price of 0.72173. Market attention is focused on the upcoming Reserve Bank of Australia (RBA) meeting, with investors highly attentive to whether the RBA will continue its rate hike policy. The strong multi-week rally has begun to lose momentum, indicating that buyers are becoming more cautious.
According to the latest market news, AUD/USD is testing the critical 0.72 level but momentum is fading as the market digests multiple factors, including the pending rate decision, geopolitical tensions, and changes in oil prices. Notably, easing signals from Iran have boosted risk sentiment, providing short-term support to the Aussie. However, as global economic uncertainty rises, investors are adopting a more cautious stance on the AUD, reflected by the price stalling after its recent strength.
For the average investor, this means that while the AUD has risen recently due to Australia’s monetary policy outlook and improving risk sentiment, close attention must be paid to the forthcoming RBA meeting outcomes as well as evolving dynamics in the global oil markets and geopolitical developments. These key factors will directly influence AUD’s medium to short-term trajectory. Maintaining vigilance and flexibility in investment strategies to adapt to short-term volatility will better position investors to capitalize on potential market opportunities.

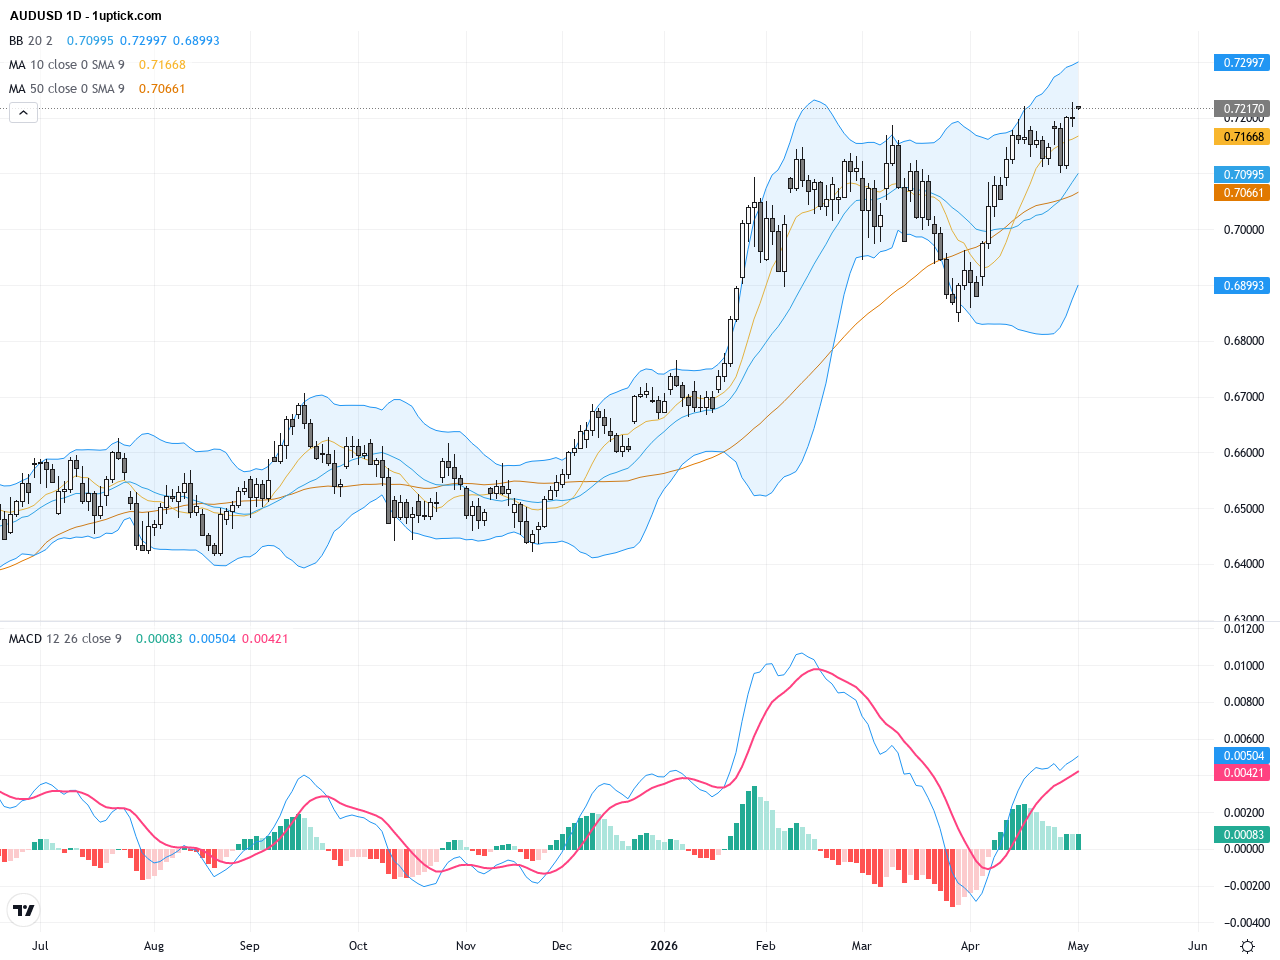
The daily chart shows a sustained uptrend from around 0.68, with AUDUSD robustly above its 50 and 200-day moving averages, confirming the medium- to long-term bullish bias. Yet, as price nears the 0.722 resistance zone, Bollinger Bands are tightening and MACD histogram shrinking with a deceleration in the moving averages, hinting at a potential momentum peak. No clear reversal patterns are present, but diminishing volume signals caution for a possible technical pullback or sideways movement.
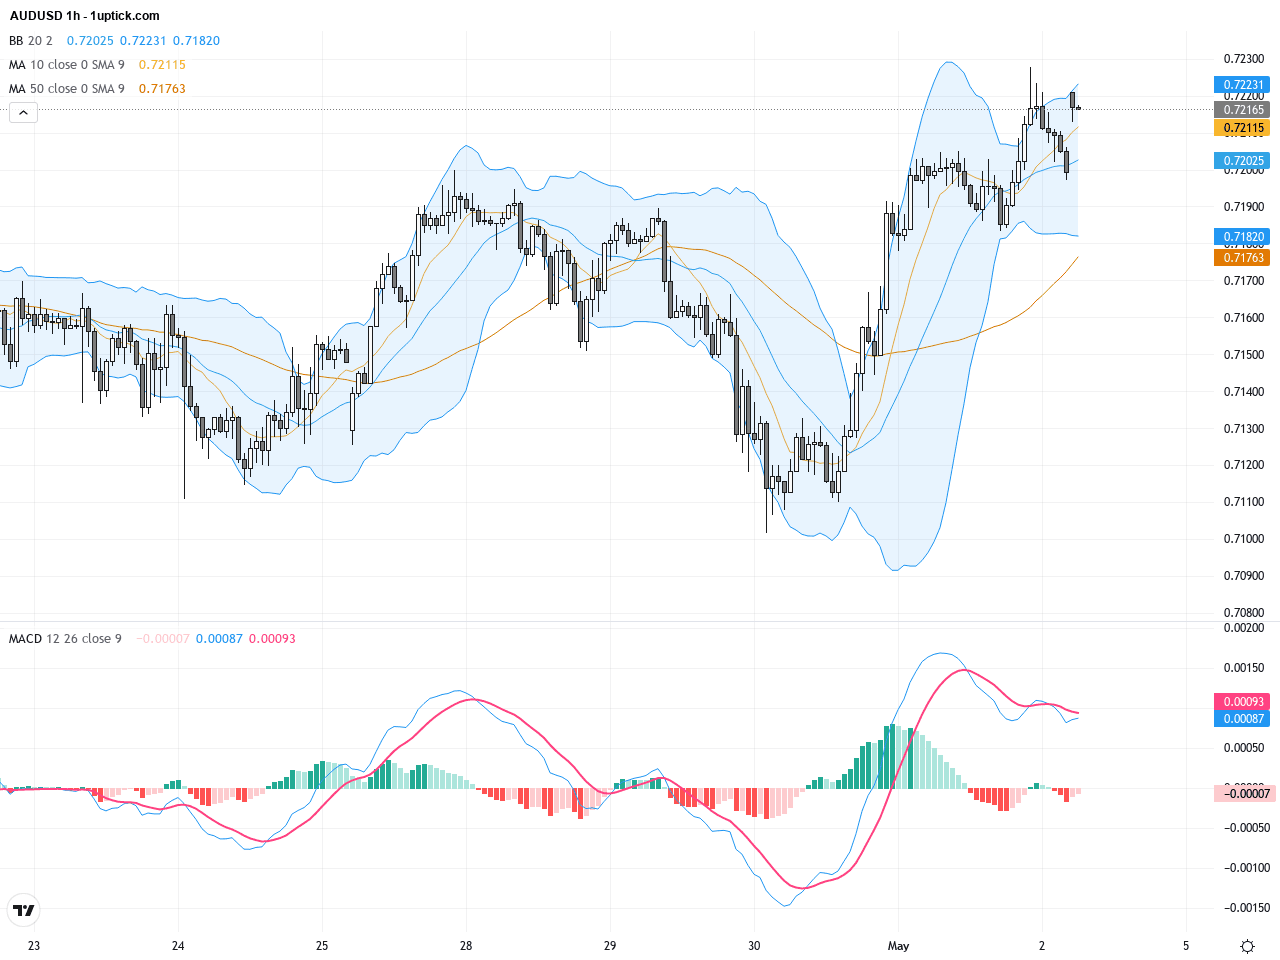
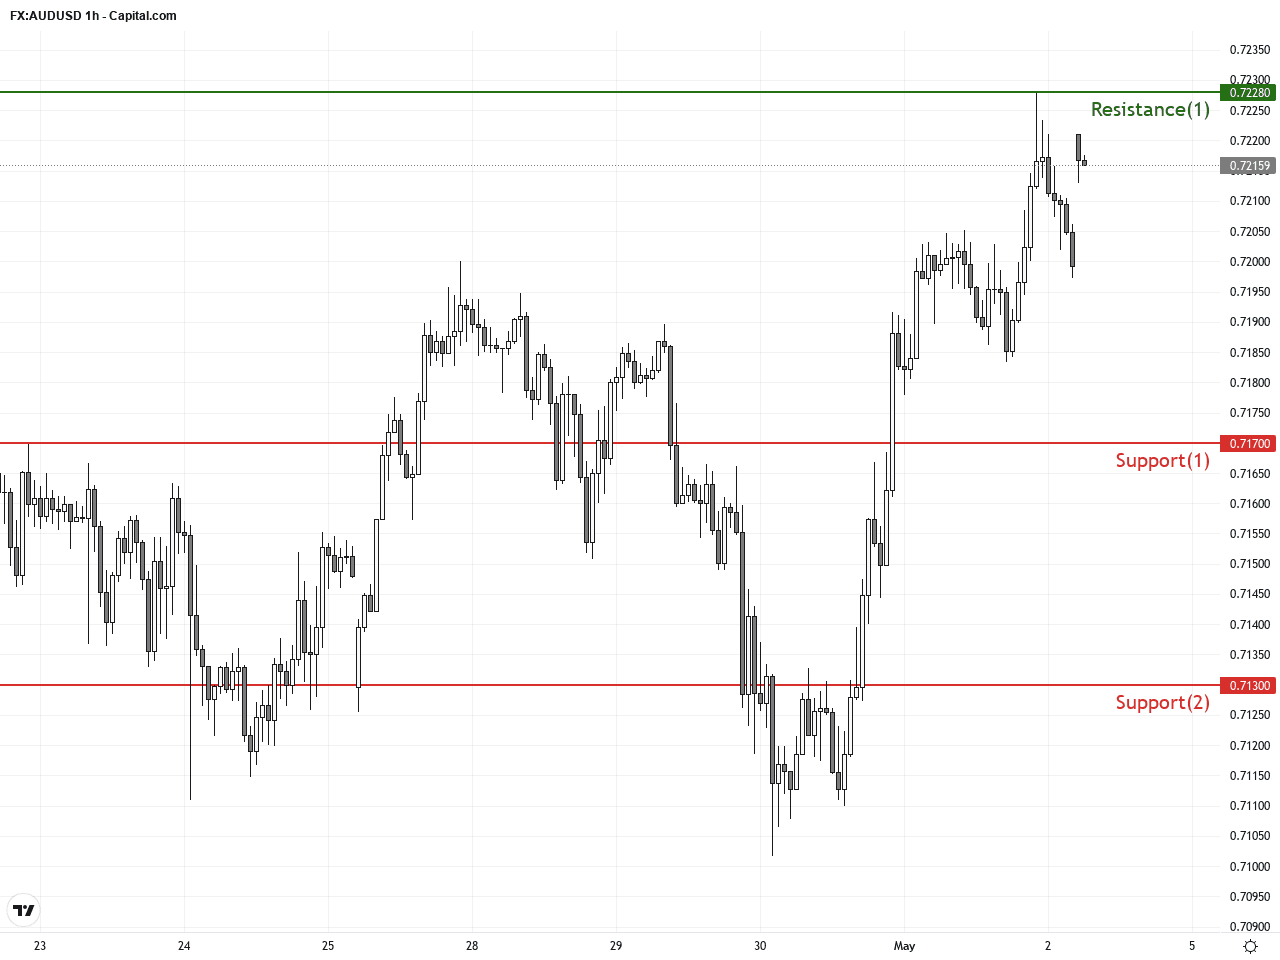
In the last five days on the hourly chart, AUDUSD exhibited strong bullish advances followed by fading momentum, with a bearish divergence forming on the MACD after a prior golden cross. The 20-period MA now acts as a support area, while Bollinger Bands narrow, indicating consolidation. Recent candlesticks include a shooting star formation, warning of short-term selling pressure. Failure to break above resistance could push price down towards support at the 0.7150-0.7160 range.
Technical Trend: The overall trend is cautiously bullish, representing a strong but momentum-diminishing phase.
Technically, AUDUSD shows signs of weakening momentum near the key 0.72 resistance as MACD approaches a bearish crossover and Bollinger Bands contract, signaling possible near-term consolidation or pullback. While the daily trend remains bullish, short-term fatigue suggests caution regarding false breakouts. Traders should watch if price firmly breaks and holds above 0.72; failure to do so may offer bounce opportunities off key support levels.There are no significant or direct economic events scheduled today that will impact AUDUSD. Traders should focus on the upcoming RBA policy meeting and overall risk sentiment, which are likely to dictate short-term price dynamics.
Resistance & Support
The above financial market data, quotes, charts, statistics, exchange rates, news, research, analysis, buy or sell ratings, financial education, and other information are for reference only. Before making any trades based on this information, you should consult independent professional advice to verify pricing data or obtain more detailed market information. 1uptick.com should not be regarded as soliciting any subscriber or visitor to execute any trade. You are solely responsible for all of your own trading decisions.