


 |
| Gold V.1.3.1 signal Telegram Channel (English) |
WTI Crude Oil: Key Support and Resistance Levels Amid Volatile Trading Outlook, May 9, 2026
2026-05-09 @ 04:30
Over the past 24 to 48 hours, WTI crude oil prices have experienced significant volatility, closing near $95.08 on May 6, a sharp drop from the previous close of $102.27. This reflects a market reevaluation of risk as the US rushes to fill the global oil supply gap. With over 280 million barrels exported in the last nine weeks and strategic reserves drawn down, the US supply dynamics have put short-term downward pressure on prices.
Meanwhile, tensions around the Strait of Hormuz and the latest US-Iran peace talks have injected uncertainty and volatility. Although oil prices briefly fell below $100, concerns over fuel shortages and production disruptions in the Gulf region continue to support price rebounds. Investor sentiment also improved somewhat due to gains in tech stocks and a decline in the volatility index, yet the oil market remains vulnerable to geopolitical risks.
For the average investor, this recent price movement illustrates the direct impact of global geopolitical tensions and supply-demand shifts on the oil market. With US export records and Middle East risks intertwining, price swings underscore the need for vigilance around macro and political risk factors, as they can rapidly trigger sharp price moves and influence investment choices and portfolio positioning.

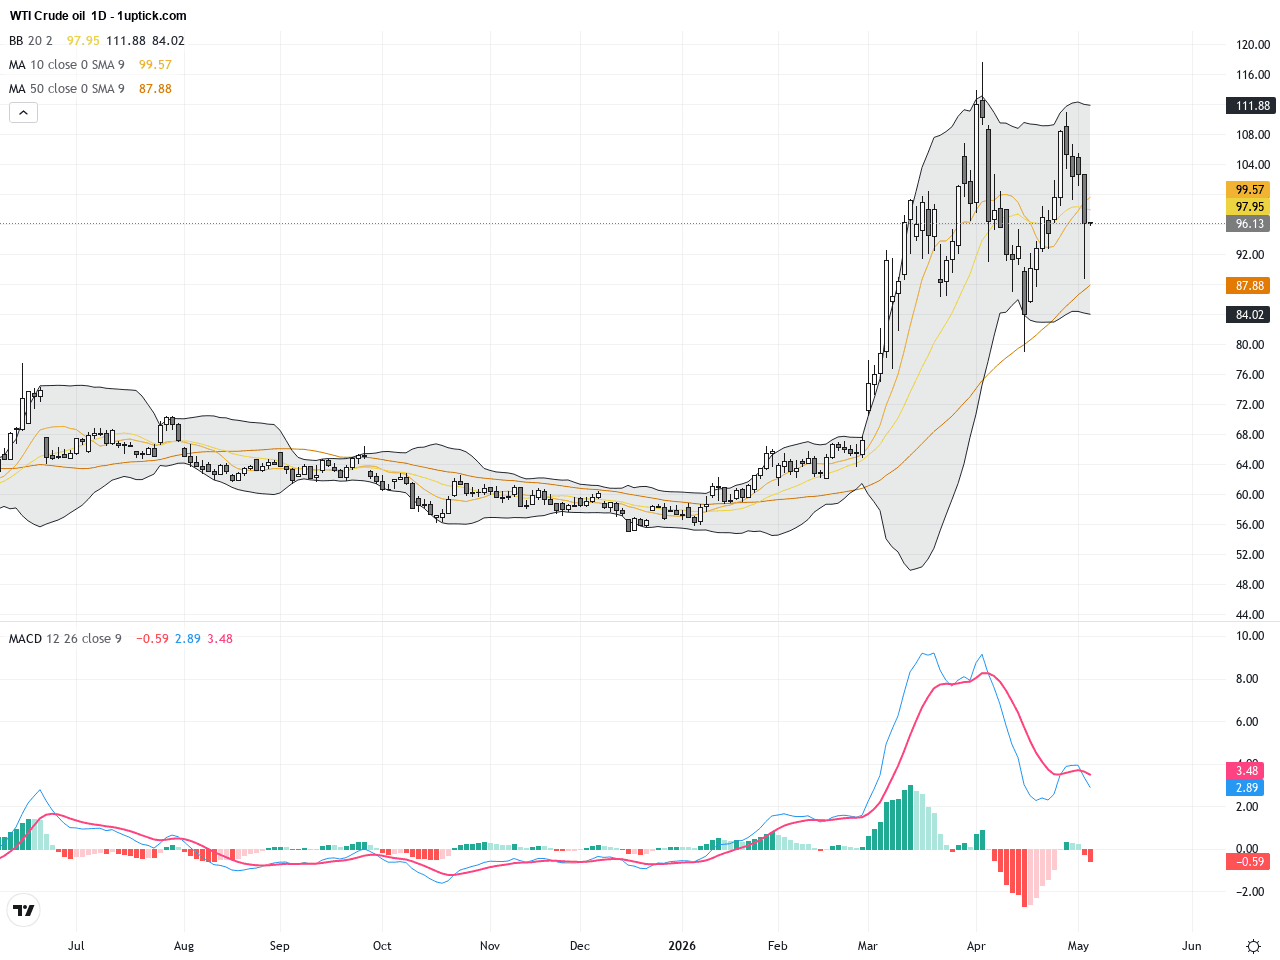
The daily chart of WTI shows a strong uptrend from around $91 in late April, peaking above $106 in early May before sharply retracing below $100. The Bollinger Bands have widened significantly, indicating increased volatility. The 50-day moving average remains beneath the price, acting as support, while the MACD is forming a bearish crossover, signaling caution for the short-term trend. This suggests potential for further pullbacks despite recent rallies.
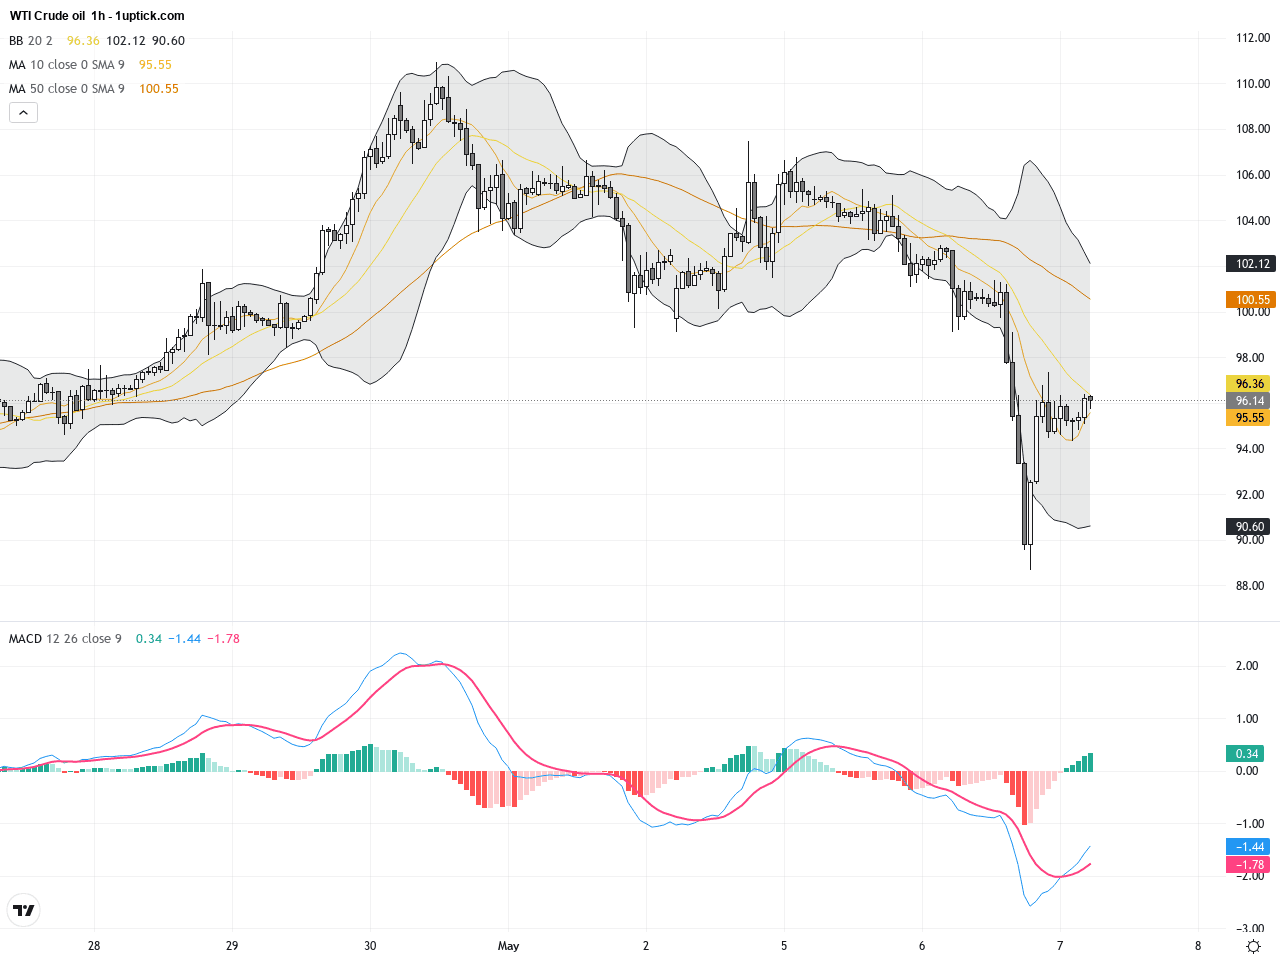
Over the past 5 days, the hourly chart demonstrates heightened volatility in WTI price action, with a swift decline to approximately $88.6 followed by a rebound near $95. Short-term moving averages are interlaced, reflecting indecision amid fluctuating support and resistance zones. Momentum indicators like MACD and RSI hint at oversold conditions with a possible rebound, but no confirmed reversal yet. Traders should remain vigilant of rapid intraday price movements.
Technical Trend: Currently, the trend is cautiously bearish with sideways volatility as the market waits for direction.
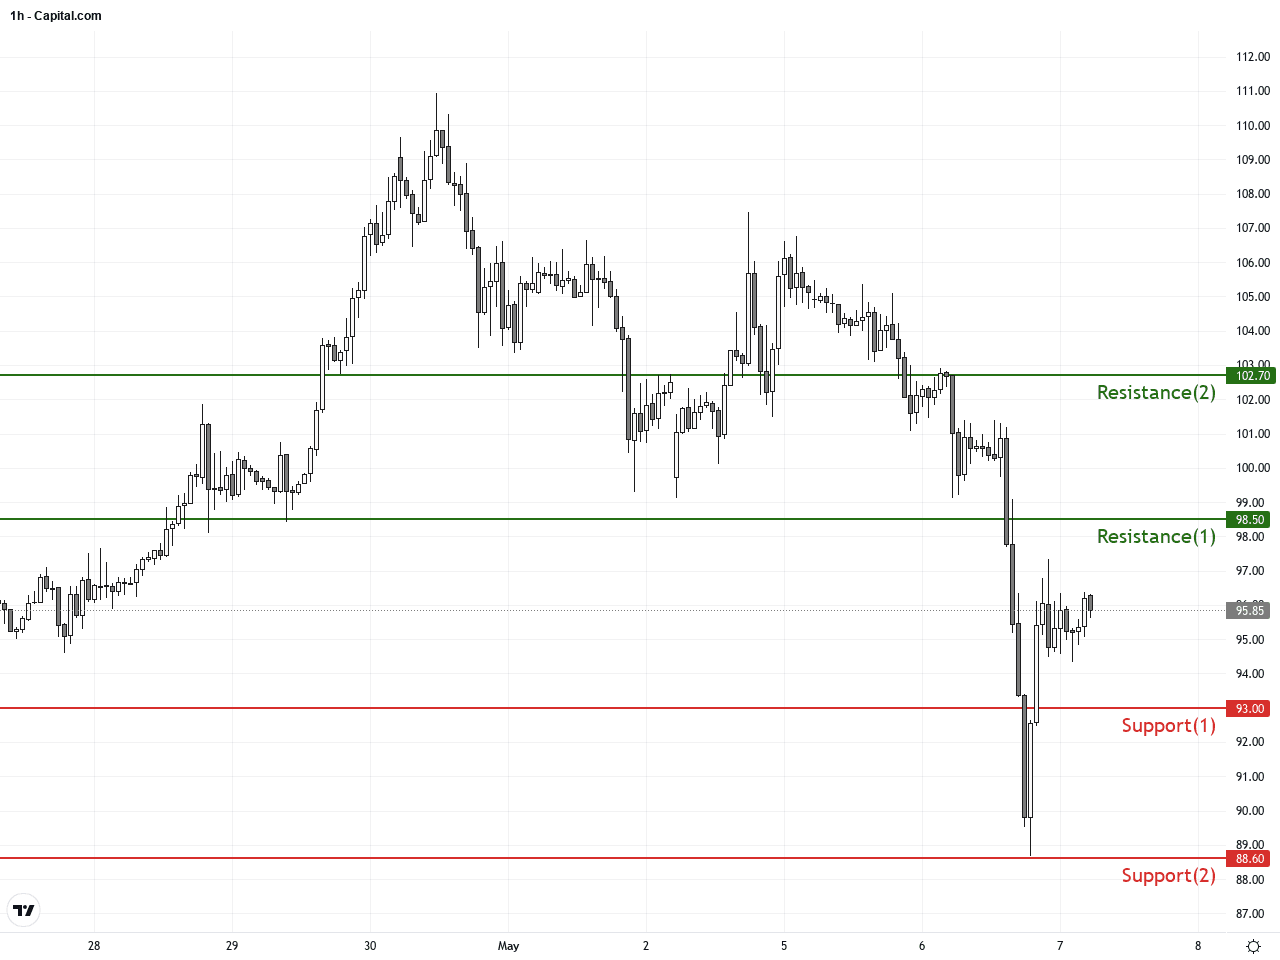
Technical analysis highlights the expanded Bollinger Bands reflecting a volatile market environment. The MACD bearish crossover combined with intertwined short-term moving averages points to a correction phase. The lack of increased volume on dips indicates no clear bottom yet, suggesting price may oscillate around key support zones. Pay close attention to the $93 to $96 range, as breaking these levels could signal the next directional move.There are no significant direct economic events scheduled today that would impact WTI Crude Oil prices. Traders should continue monitoring geopolitical developments and US energy policies closely.
Resistance & Support
The above financial market data, quotes, charts, statistics, exchange rates, news, research, analysis, buy or sell ratings, financial education, and other information are for reference only. Before making any trades based on this information, you should consult independent professional advice to verify pricing data or obtain more detailed market information. 1uptick.com should not be regarded as soliciting any subscriber or visitor to execute any trade. You are solely responsible for all of your own trading decisions.