 |
| Gold V.1.3.1 signal Telegram Channel (English) |

USDCAD Trading Outlook: Four-Day Rally Pushes Price Near Key 1.37 Resistance Amid Oil and Safe-Haven Demand, May 12, 2026
2026-05-12 @ 13:01
Over the past 24 to 48 hours, USD/CAD exhibited slight volatility, but the overall trend leaned towards USD appreciation. The pair closed at 1.36922 yesterday, almost unchanged from the previous day, with trading hovering around 1.3690 during Asian hours amid a rebound led by continued safe-haven demand for the US dollar.
The main drivers behind this price action are rising geopolitical tensions involving Iran and strong US jobs data, both intensifying investor risk aversion and boosting the USD. Although the Canadian dollar, closely linked to oil prices as Canada is a major exporter, received some support from recent crude price gains, it was not enough to counter the USD’s strength in the short term, keeping CAD under pressure.
In simple terms, for everyday investors, when global geopolitical uncertainties rise, capital tends to move into safe-haven assets and the US dollar, benefiting those holding USD. Meanwhile, the oil-dependent Canadian dollar suffers from investor jitters, pushing the USD/CAD rate slightly higher.
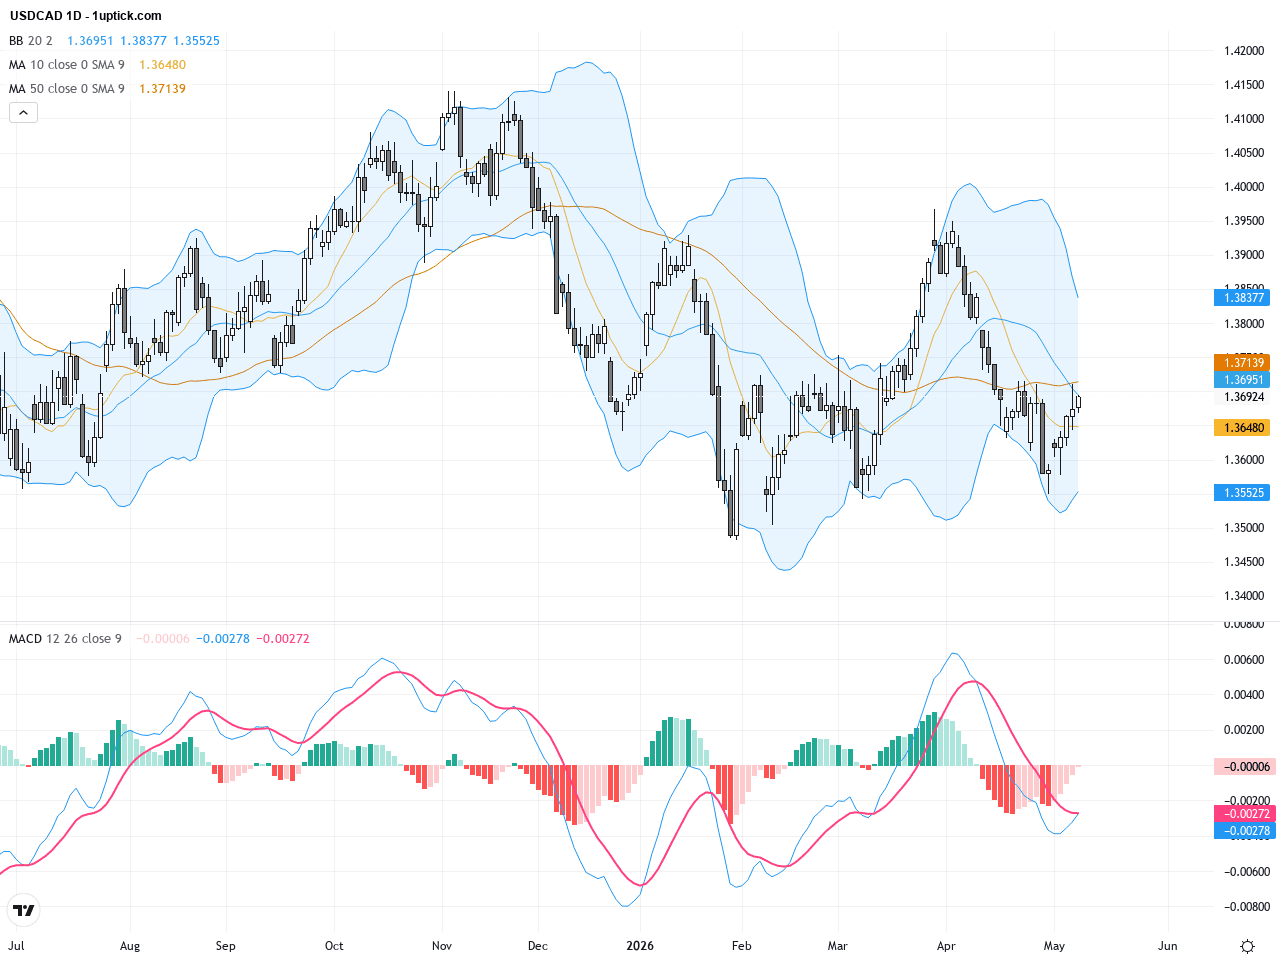
The daily chart shows a clear rebound from recent lows with USDCAD steadily climbing towards the 1.37 resistance zone. The 20-day and 50-day moving averages are in a subtle convergence, with the shorter moving average nearing a bullish crossover. Bollinger Bands are contracting, but price has broken above the midline, indicating accelerating bullish momentum. The MACD features a golden cross with the fast line rising steadily accompanied by positive histogram bars, supporting an upward trend continuation.
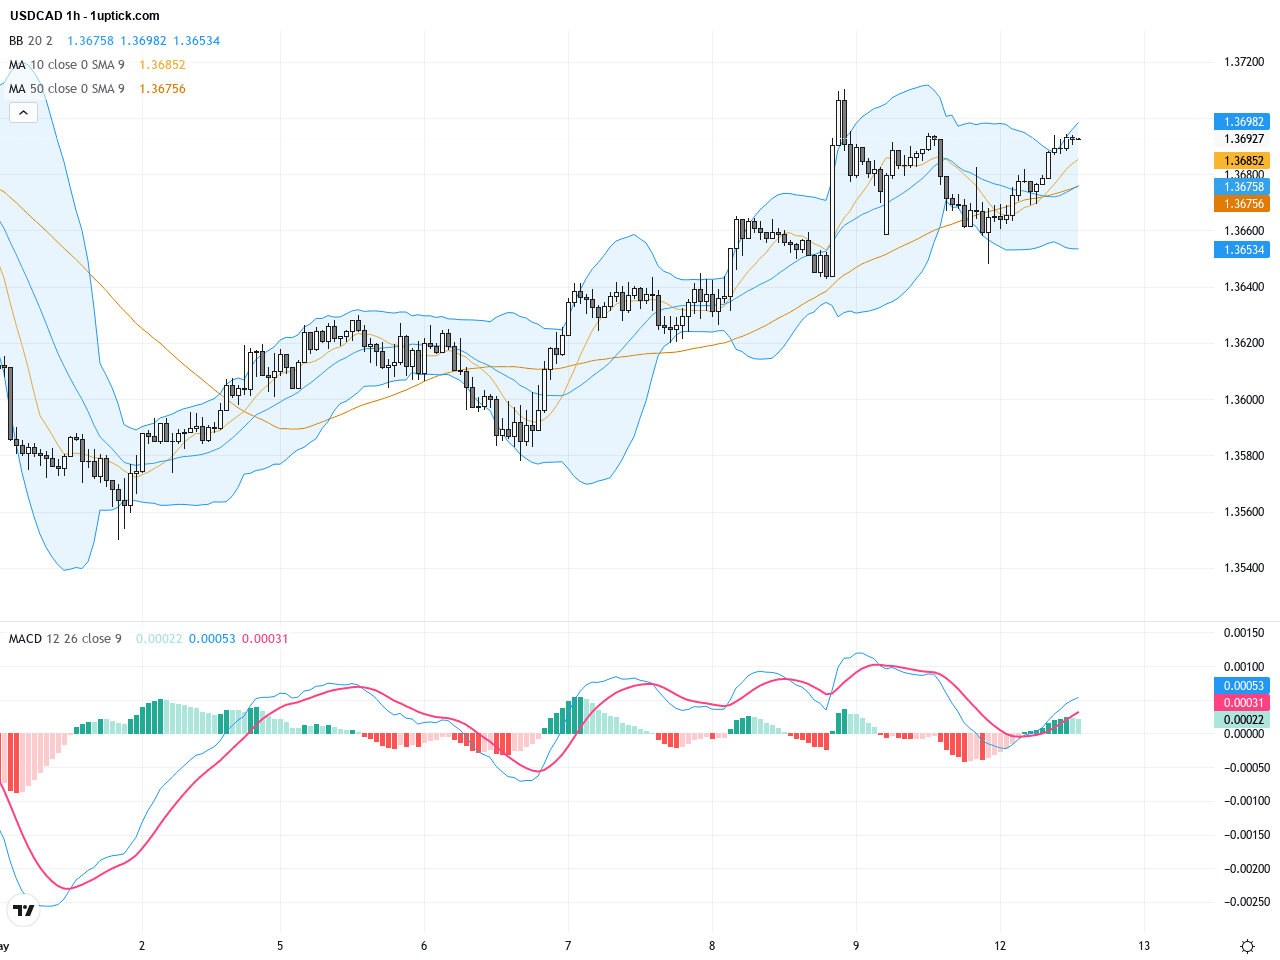
Hourly price action over the past 3-5 days depicts a short-term ascending channel between 1.366 and 1.37. The 50-hour and 20-hour moving averages maintain a bullish alignment, with price continually testing the upper Bollinger Band, signifying active buying interest. MACD remains positive and RSI is elevated but not yet overbought. Notably, a small bullish flag pattern has formed suggesting a potential breakout continuation shortly.
Technical Trend: Decisively bullish with market sentiment trending steadily upward.
Technically, USDCAD is showing signs of short-term strength with a MACD golden cross confirming bullish momentum and Bollinger Bands widening as price hugs the upper band. The intraday bullish flag pattern indicates the possibility of further upside continuation. The consecutive four-day rally validates intensified demand for safe-haven US dollar assets. Traders should closely watch support levels for risk management and remain mindful of oil price trends reflecting underlying Canadian fundamentals.Today’s economic calendar lacks direct data releases that specifically impact USDCAD. However, the upcoming US Consumer Price Index (CPI) and core CPI reports at 14:30 GMT+1 are crucial. Stronger-than-expected inflation may strengthen the US dollar, buoying USDCAD higher. Additionally, crude oil inventory data will indirectly affect the loonie, given Canada’s commodity exposure. Ongoing geopolitical risks continue to create volatility and remain a key market driver.
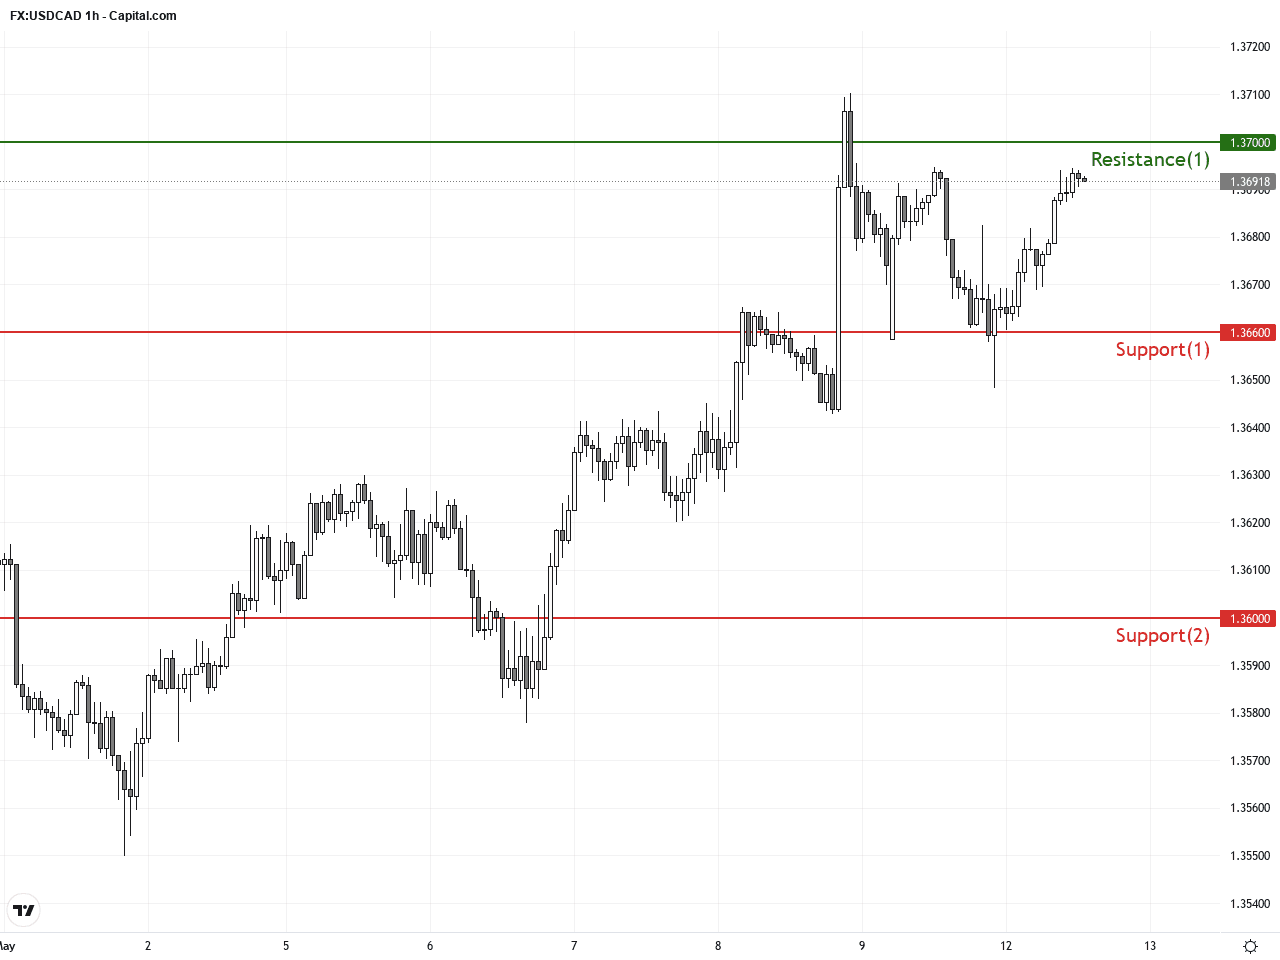
Resistance & Support
The above financial market data, quotes, charts, statistics, exchange rates, news, research, analysis, buy or sell ratings, financial education, and other information are for reference only. Before making any trades based on this information, you should consult independent professional advice to verify pricing data or obtain more detailed market information. 1uptick.com should not be regarded as soliciting any subscriber or visitor to execute any trade. You are solely responsible for all of your own trading decisions.