 |
| Gold V.1.3.1 signal Telegram Channel (English) |
USDJPY: Intervention Risk Caps Rally as Key Resistance Nears 158, May 11, 2026
2026-05-11 @ 11:01
Over the past 24 to 48 hours, the USD/JPY pair has exhibited a notable corrective phase. Yesterday’s closing price was around 157.14, with the currency hovering near this level amid heightened sensitivity to potential Japanese government intervention aimed at stabilizing the yen. Recent reports highlight Japan has spent billions to curb the yen’s decline, yet analysts remain skeptical about these measures reversing the broader weakening trend.
The yen’s sudden sharp rise recently triggered speculation over further interventions by Tokyo. This underscores the Japanese authorities’ resolve to prevent excessive depreciation, especially as USD/JPY approaches the critical 160 level where intervention risk intensifies. Compared to the prior close of 156.62, the USD/JPY has slipped over 0.5%, but the threat of intervention continues to cap substantial gains.
For the average investor, this means the USD/JPY will likely remain volatile and closely tied to central bank moves and intervention rumors. Despite pressure on the yen, risk awareness among traders keeps the pair range-bound. Investors should watch closely for further Japanese policy actions and global risk sentiment shifts, as these will decisively impact USD/JPY’s short-term price dynamics and volatility.
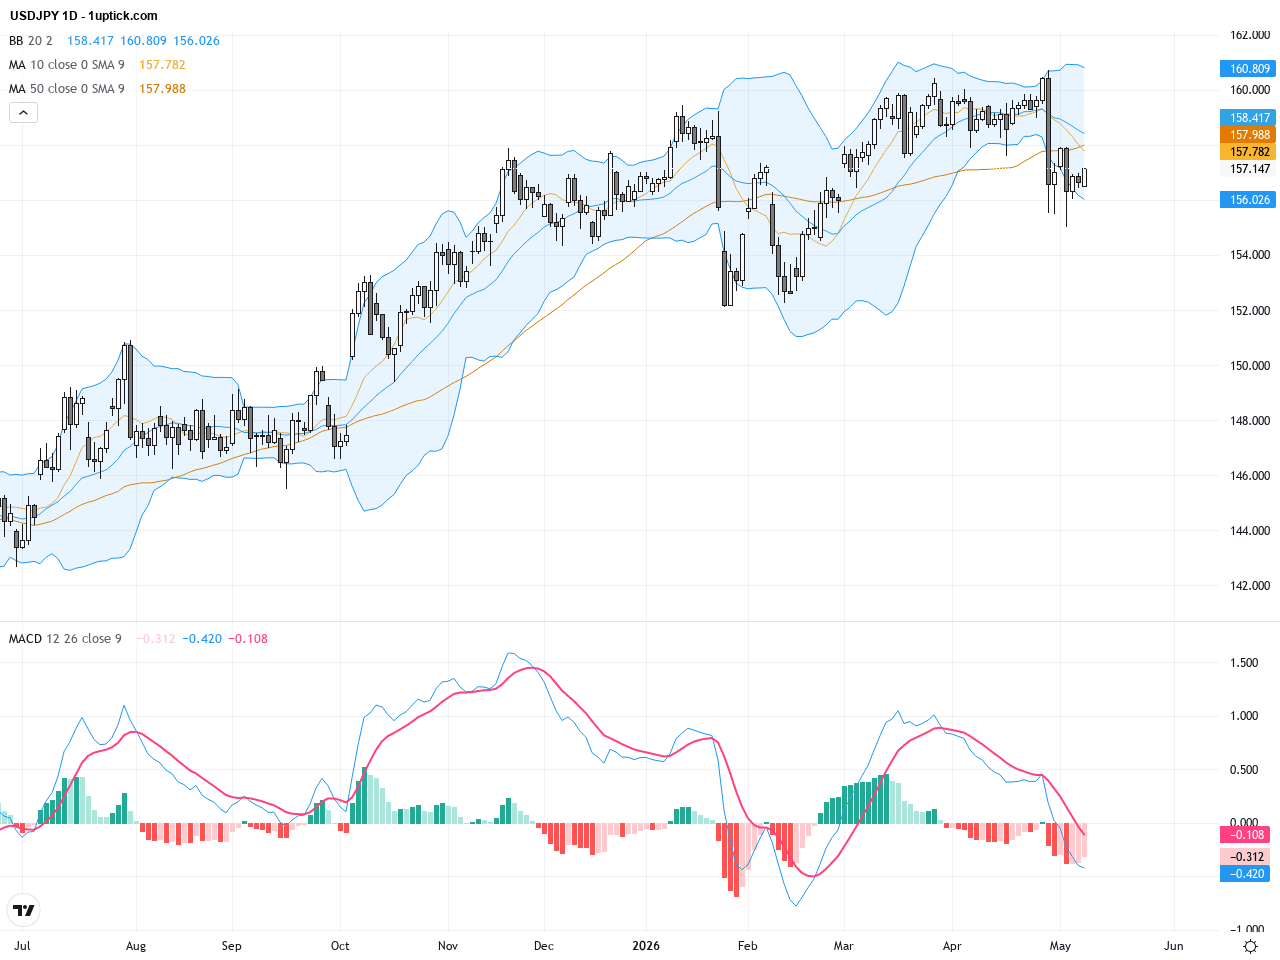
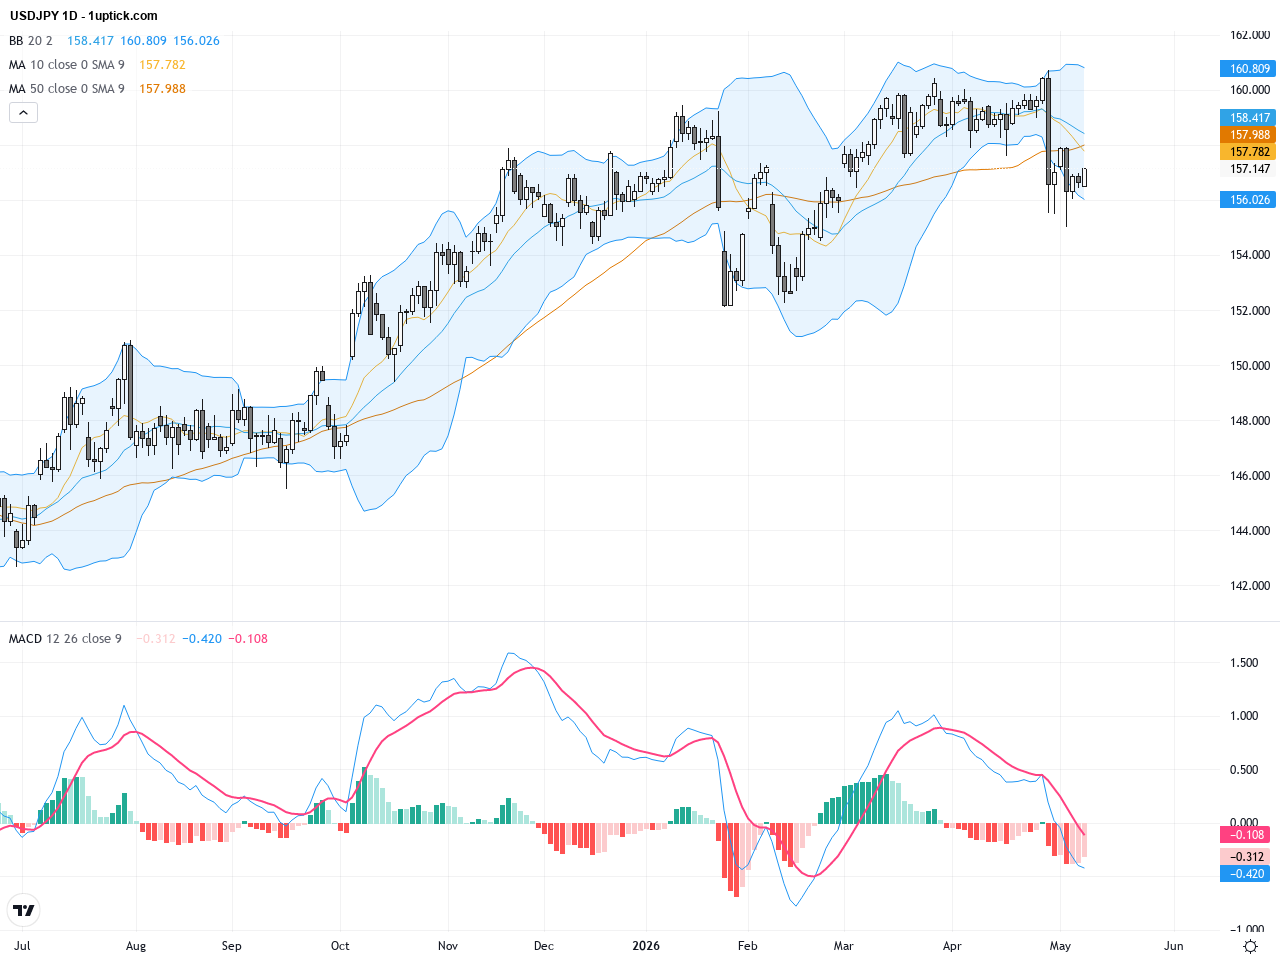
On the daily chart, USDJPY reveals a range-bound pattern with a bullish bias but facing resistance near the 158 level. Since mid-March, the pair has maintained an upward trajectory with the 50-day MA above the 200-day MA, indicating overall bullish momentum. The Bollinger Bands show repeated touches at the upper band followed by pullbacks, hinting at increased short-term volatility. The MACD histogram shrinking signals weakening momentum, suggesting caution for further advances. The overall technical setup still favors bulls but price struggles near resistance might lead to consolidation or short-term pullbacks.
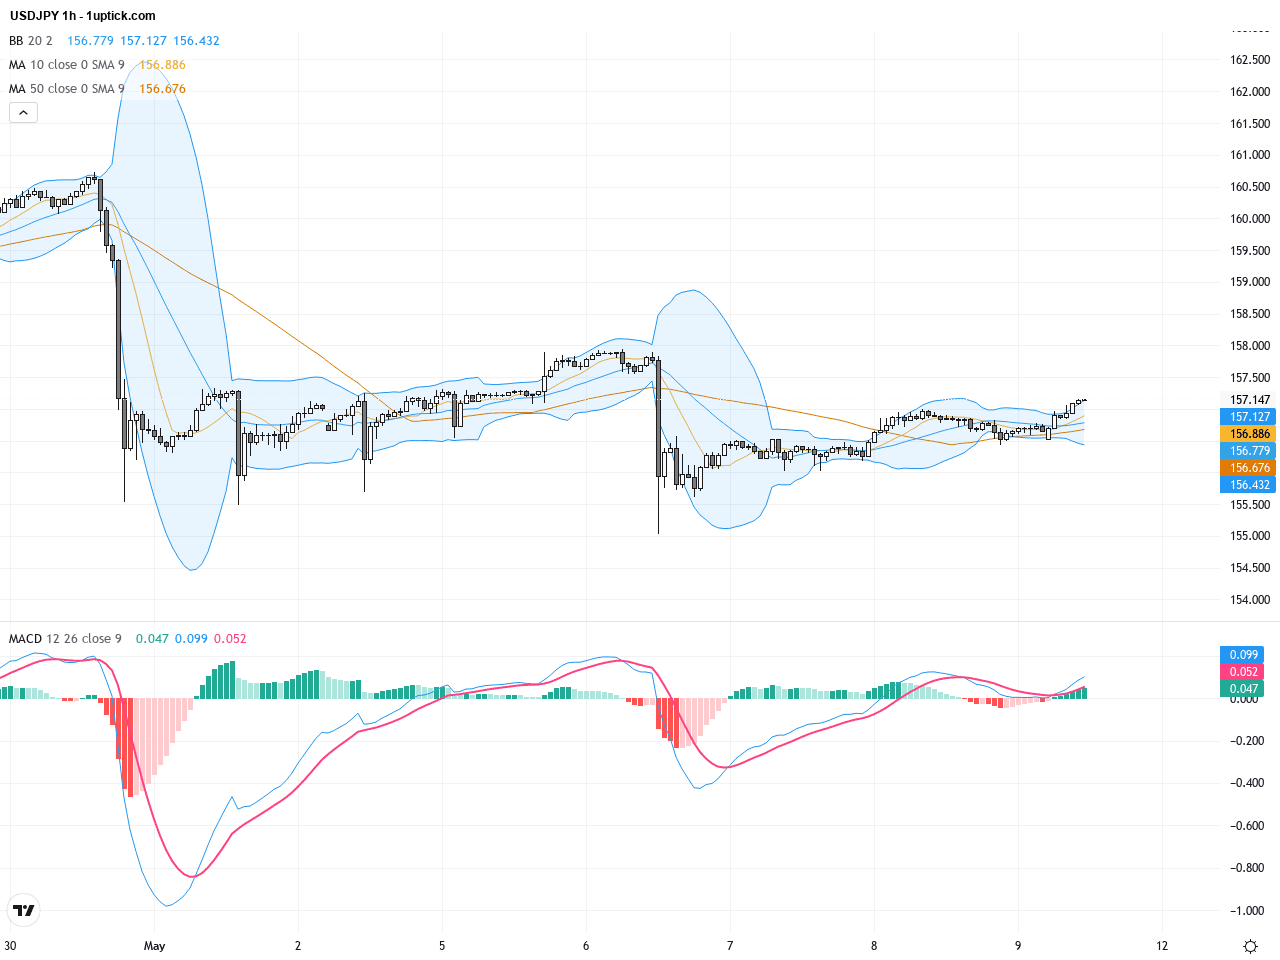
Focusing on the hourly chart over the last 3-5 days, USDJPY fluctuates closely around 157. The pair broke above the 60-period moving average but soon retraced, with narrowing Bollinger Bands indicating compressed volatility. A recent MACD bearish crossover points to rising selling pressure, while RSI approaches oversold levels, implying the potential for either a bounce or continued sideways movement. A descending triangle pattern is forming, suggesting price is gearing up for a directional breakout depending on the support level. Traders should watch closely for confirmed breaks to define next moves.
Technical Trend: USDJPY currently trades in a cautiously consolidating phase, with evident price oscillations and heightened sensitivity to intervention risk, resulting in a volatile sideways trend.
Technically, USDJPY is showing signs of a short-term corrective pullback amid persistent intervention concerns. An ascending wedge pattern recently developed and was broken downward on the hourly chart, signaling potential short-term downside risk. The MACD bearish crossover coupled with a declining RSI strengthens the bearish case. Several small engulfing candlestick patterns on the daily timeframe highlight increased market indecision. Traders should remain mindful of both the fundamental intervention risk and nearby technical support levels when planning positions.Today’s economic calendar presents no major direct events impacting USDJPY. Chinese CPI and PPI data released early exceeded expectations, but the effects on the USDJPY pair remain limited. The US Existing Home Sales report, scheduled for 16:00 GMT+1, may influence dollar strength to an extent but is unlikely to cause significant immediate volatility in USDJPY. Overall, no key events today are expected to drive sharp moves in this currency pair.
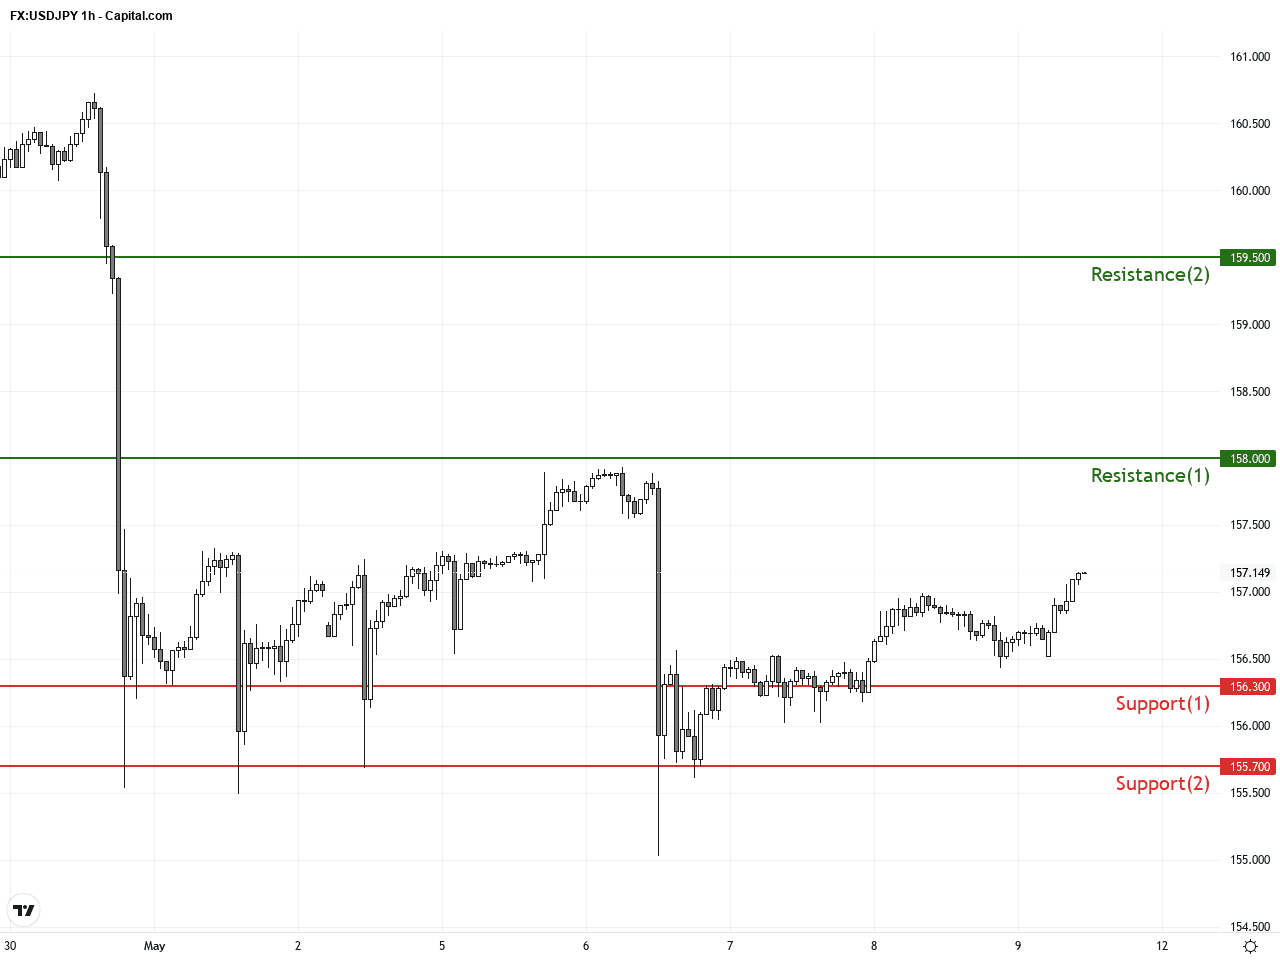
Resistance & Support
The above financial market data, quotes, charts, statistics, exchange rates, news, research, analysis, buy or sell ratings, financial education, and other information are for reference only. Before making any trades based on this information, you should consult independent professional advice to verify pricing data or obtain more detailed market information. 1uptick.com should not be regarded as soliciting any subscriber or visitor to execute any trade. You are solely responsible for all of your own trading decisions.