 |
| Gold V.1.3.1 signal Telegram Channel (English) |

USDCAD: Eyeing 1.4200 Resistance as Bullish Momentum Persists, June 23, 2026
2026-06-23 @ 13:01
Over the past 24 to 48 hours, USD/CAD has shown a robust upward momentum, climbing from an opening price of 1.41521 to a daily high of 1.41748, with yesterday’s close at 1.41736, marking an approximate 0.15% increase from the previous session. The market clearly reacted to the economic divergence between the US and Canada during this period, propelling the US dollar against the Canadian dollar.
According to the latest market news, Canada’s inflation rate exceeded the Bank of Canada’s target band in May, causing cautious sentiment regarding Canada’s monetary policy outlook. However, the overall market remains tilted toward US dollar strength, supported by the US interest rate environment and economic data. Headlines such as the UK Prime Minister’s resignation and progress in Iran-US negotiations briefly spiked volatility but did not fundamentally alter the USD/CAD dynamics.
For the average investor, the recent USD/CAD appreciation is largely driven by differences in monetary policy and economic indicators between the two countries. While Canadian inflation pressures rise, market participants remain watchful of their central bank’s stance, whereas the US economic outlook appears stronger. This scenario presents risk management considerations for portfolios holding Canadian dollar assets. Investors should closely monitor upcoming USD/CAD moves and central bank communications.
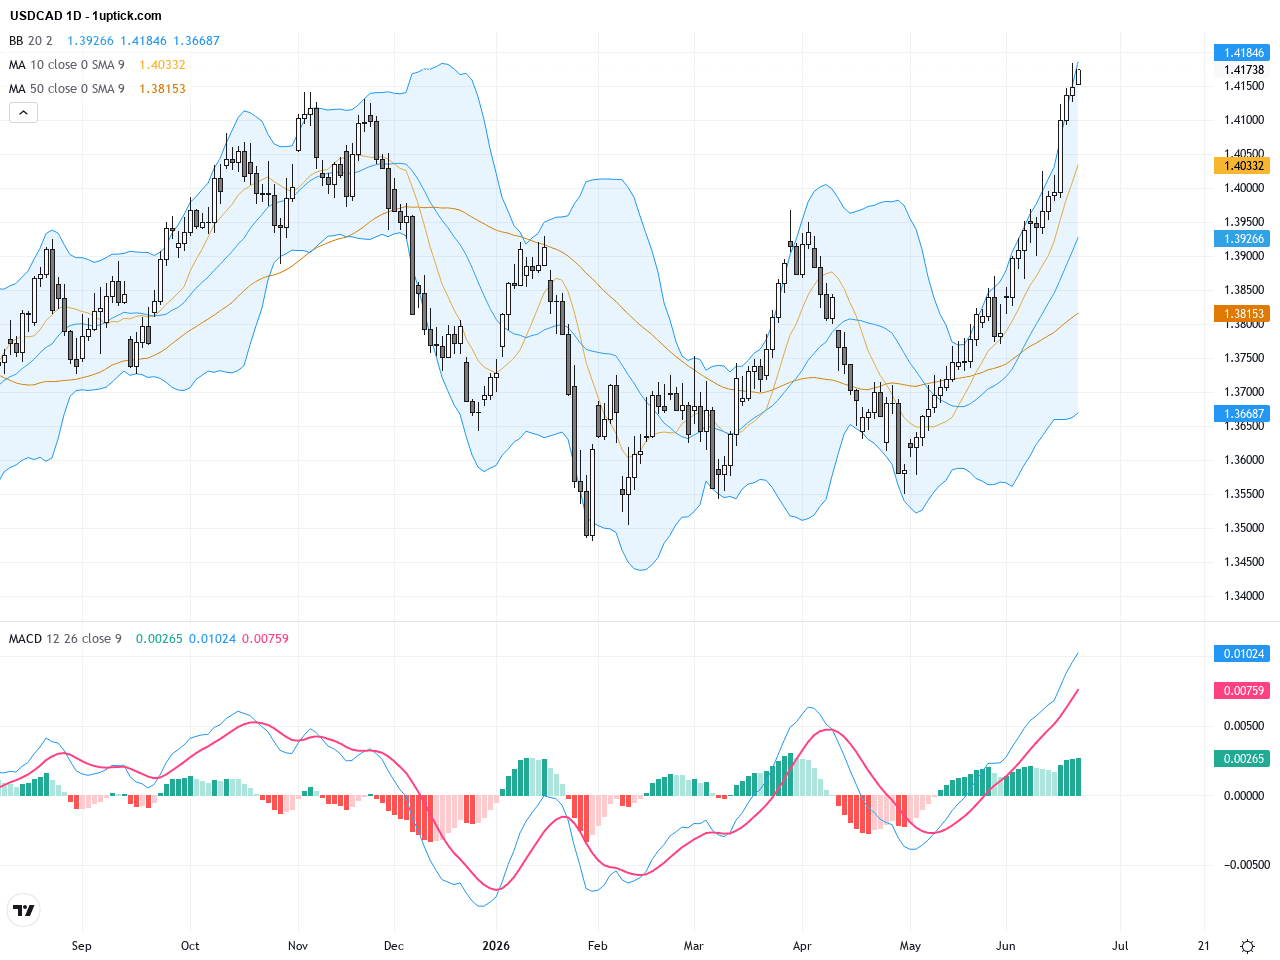
The daily chart reveals a solid uptrend in USDCAD, with prices consistently holding above the 1.40 level and reaching 14-month highs. The 20-day and 50-day moving averages are aligned bullishly, reinforcing a strong long-term buy signal. Bollinger Bands are widening, indicating increased volatility, and the MACD remains above zero, confirming solid bullish momentum. Overall, the daily timeframe favors a bullish outlook with potential for trend continuation.
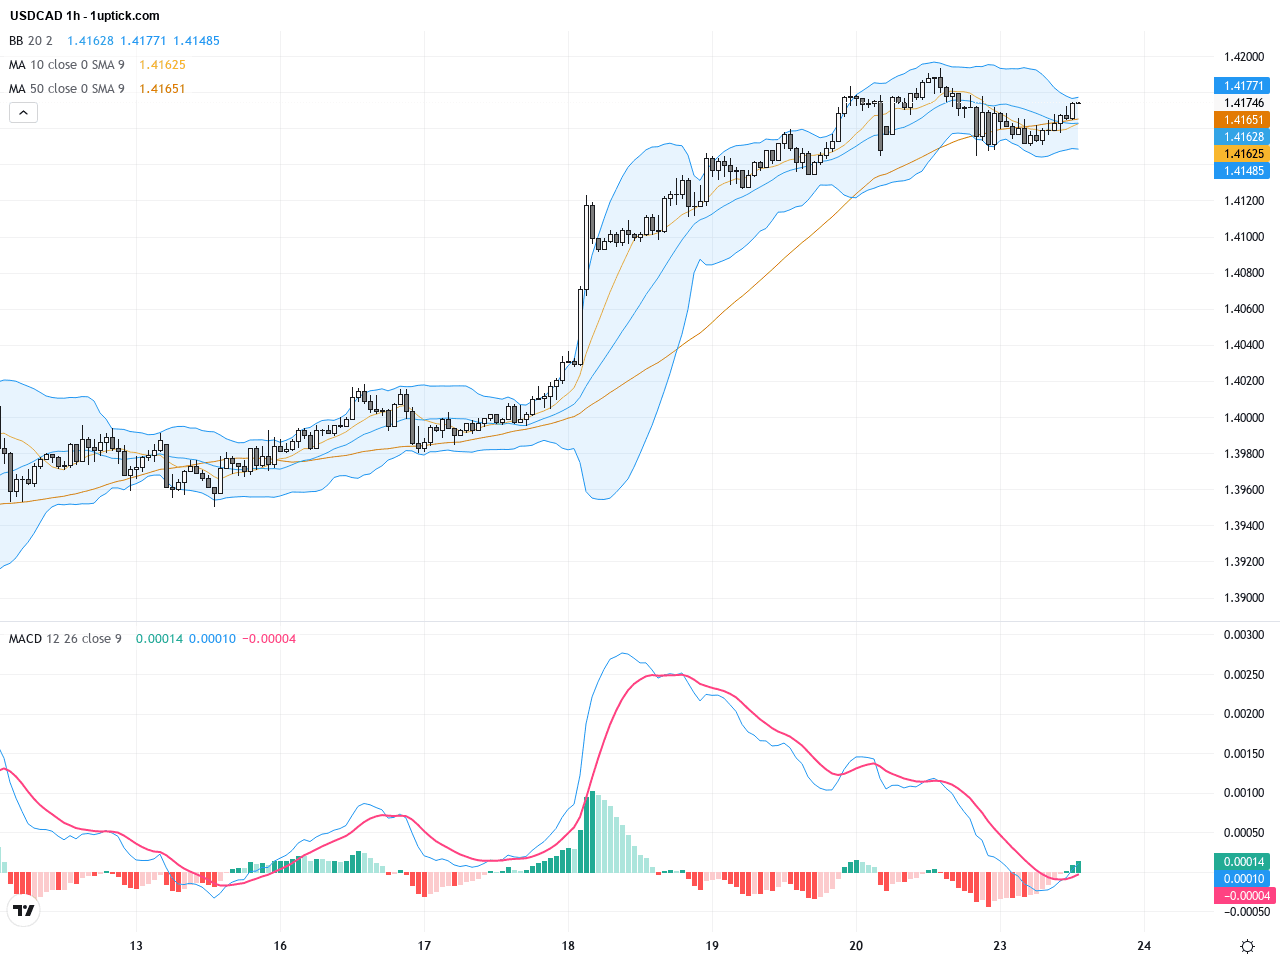
The hourly chart reflects short-term price movements over the last 3-5 days. USDCAD has exhibited a stair-stepped uptrend, consolidating within the 1.4150 to 1.4200 range. The EMA10 and EMA20 are crossing upwards, supported by expanding MACD histogram bars, signaling strengthened short-term buying momentum. A bullish flag pattern appears to be forming; a breakout above 1.4200 could trigger another wave of upward movement.
Technical Trend: The current trend is a clear bullish trend, best described as a “Decisively Bullish” setup.
Key technical insight centers on the critical resistance zone at 1.4200. A daily close above this level would validate continuation of the bullish trend. The MACD remains in strong upward momentum; combined with increasing volume and volatility, buyers appear primed for further gains. The recent bullish engulfing candlestick reinforces confidence in the upward move. However, watch for potential short-term pullbacks if price hits strong resistance and profit-taking ensues.Today’s GMT+1 economic calendar presents no major US or Canadian data releases directly impacting USDCAD, with the focus largely on European, Japanese, and UK PMI readings. The most relevant event is the Bank of Canada Governor Macklem’s speech at 15:00, which could cause short-term volatility depending on monetary policy remarks. Other releases are predominantly EU and UK-focused and unlikely to strongly affect the USDCAD currency pair today.
Resistance & Support

The above financial market data, quotes, charts, statistics, exchange rates, news, research, analysis, buy or sell ratings, financial education, and other information are for reference only. Before making any trades based on this information, you should consult independent professional advice to verify pricing data or obtain more detailed market information. 1uptick.com should not be regarded as soliciting any subscriber or visitor to execute any trade. You are solely responsible for all of your own trading decisions.