


 |
| Gold V.1.3.1 signal Telegram Channel (English) |

XAUUSD Technical & Fundamental Analysis: Gold Faces Key Support Amid Dollar Strength, June 23, 2026
2026-06-23 @ 05:04
Over the past 48 hours, the gold market (XAUUSD) has experienced significant volatility, with the price trading around yesterday’s close of 4191.165 USD. After a brief pullback, market participants have refocused on gold’s safe-haven role amid several key developments.
The recent hawkish tone from the U.S. Federal Reserve has raised concerns over potential interest rate hikes, pushing the U.S. dollar higher and putting downward pressure on gold prices. Furthermore, Goldman Sachs cut its year-end gold forecast by $500, reflecting diminished expectations of Fed rate cuts and amplifying near-term bearish sentiment for gold.
At the same time, easing tensions in the Middle East have softened one of gold’s traditional support pillars. With an Iran-Israel conflict de-escalating and the U.S. President calling off planned military strikes, geopolitical risk eased somewhat. This caused a short-lived rebound in gold prices but was overshadowed by the stronger dollar and higher yields.
For the average investor, this scenario illustrates a key point: gold’s volatility is increasingly driven by shifts in Fed policy outlook and geopolitical developments. Unlike prior periods when gold primarily benefitted from risk-off trading, the current environment sees the metal pressured by hawkish Fed signals and a robust dollar, calling for cautious stance toward gold investments at this juncture.
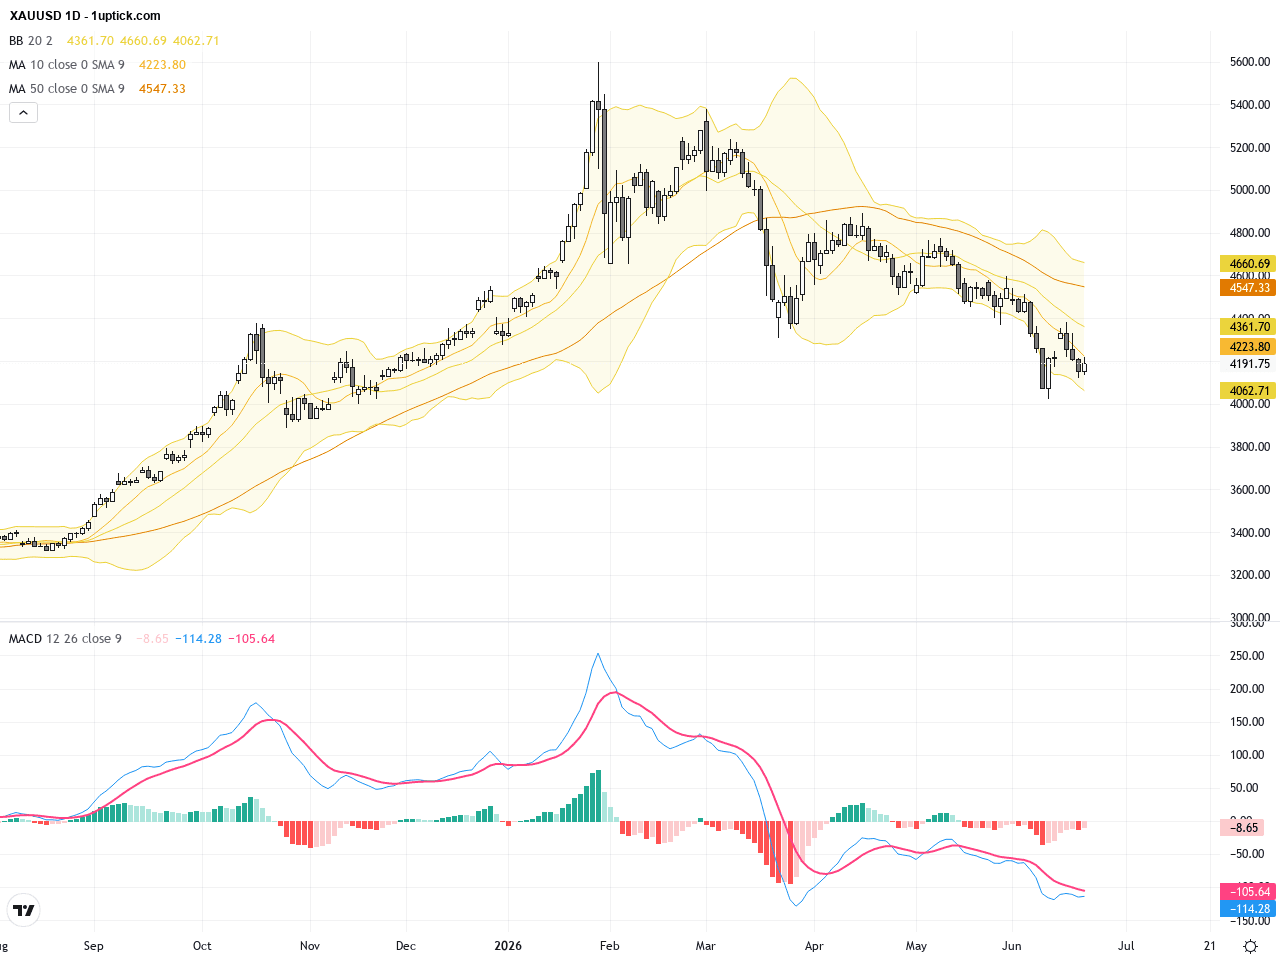
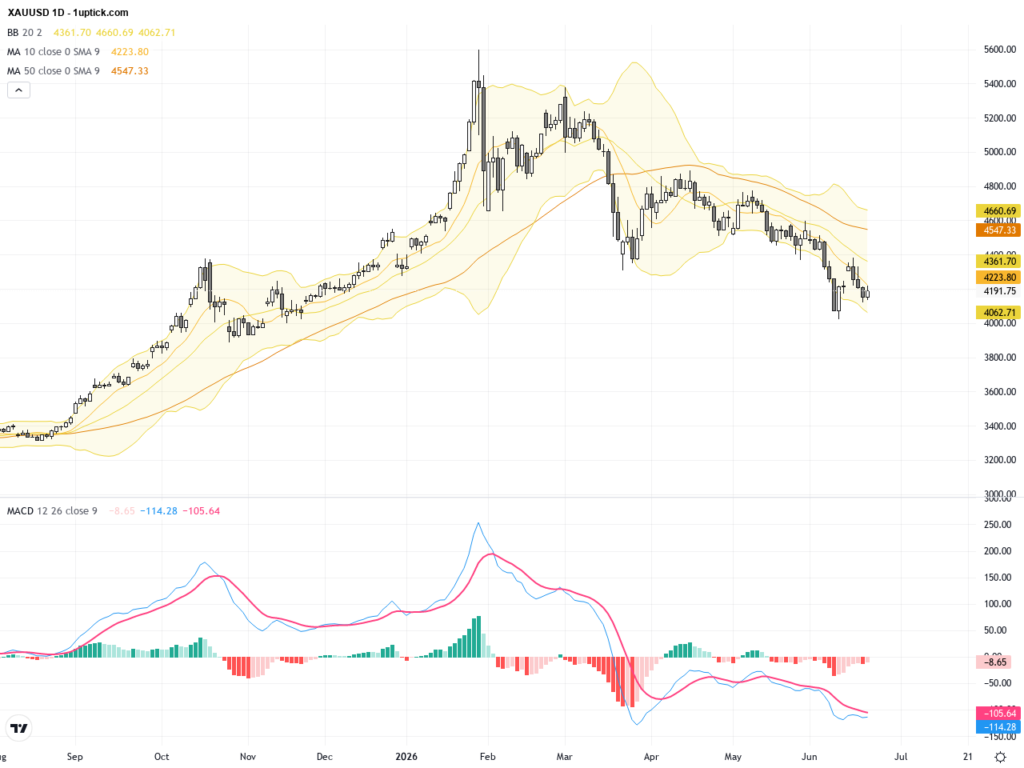
The daily chart of XAUUSD shows a clear downtrend over the past several weeks, with prices steadily falling and finding short-term support near 4200 USD. The 20-day and 50-day moving averages have formed a death cross, indicating sustained medium-to-long term selling pressure. Bollinger Bands have narrowed indicating decreasing volatility and potential upcoming breakout. Meanwhile, the MACD indicator remains below the zero-line, reflecting weak short-term momentum and a bearish bias overall.
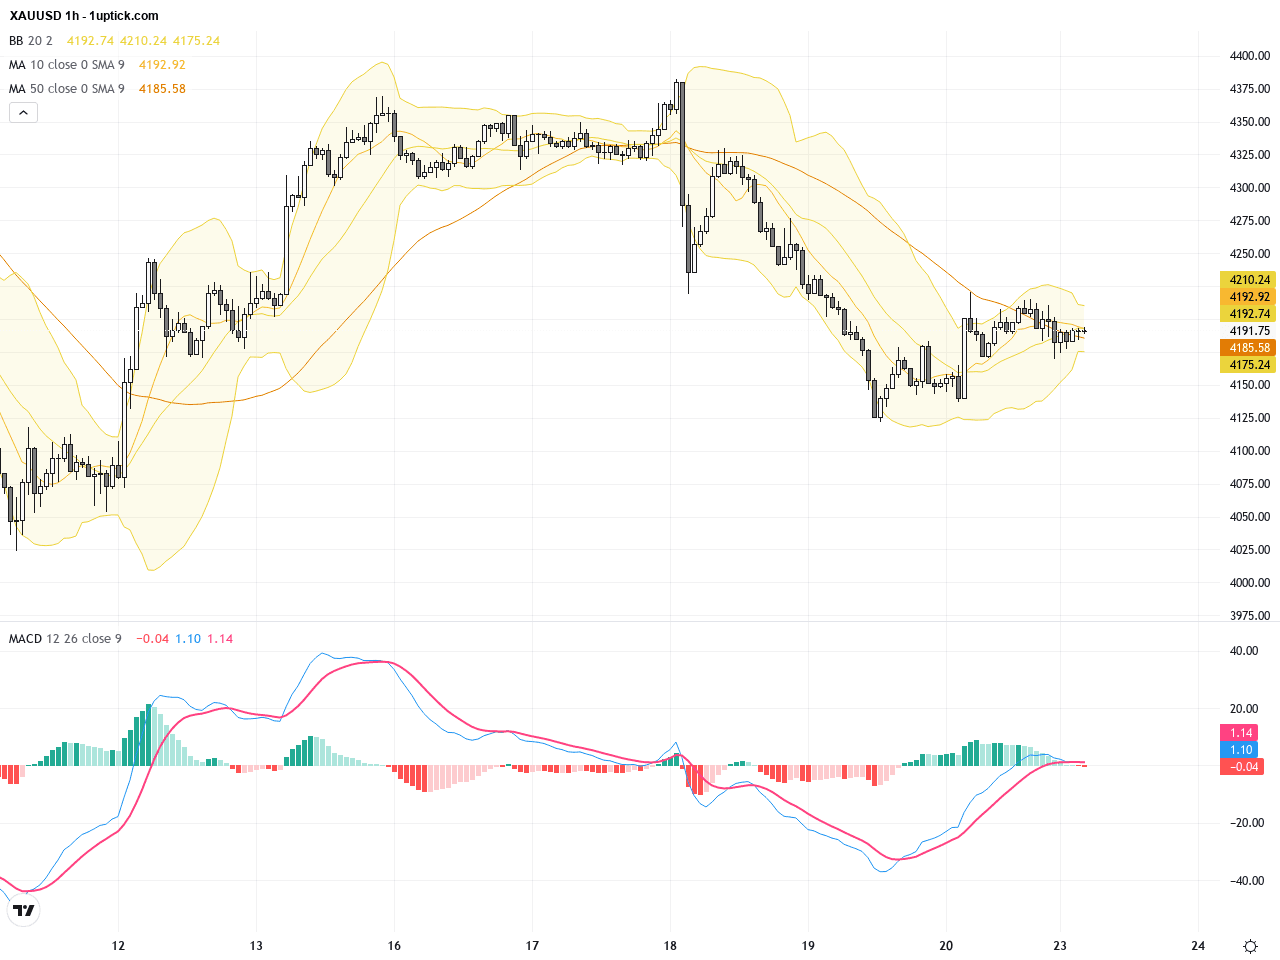
In the hourly chart covering the last 3-5 days, price action has formed a symmetrical triangle around the 4180 to 4220 USD range. This pattern suggests potential breakout soon. The 20-hour and 50-hour moving averages are tightly entwined, Bollinger Bands show slight volatility expansion, and MACD is near a bullish crossover, signaling a possible short-term rebound. The recent bullish engulfing candlestick also supports a positive intraday move.
Technical Trend: Consolidation with bearish bias amid strong dollar pressure and geopolitical factors, caution advised awaiting breakout.
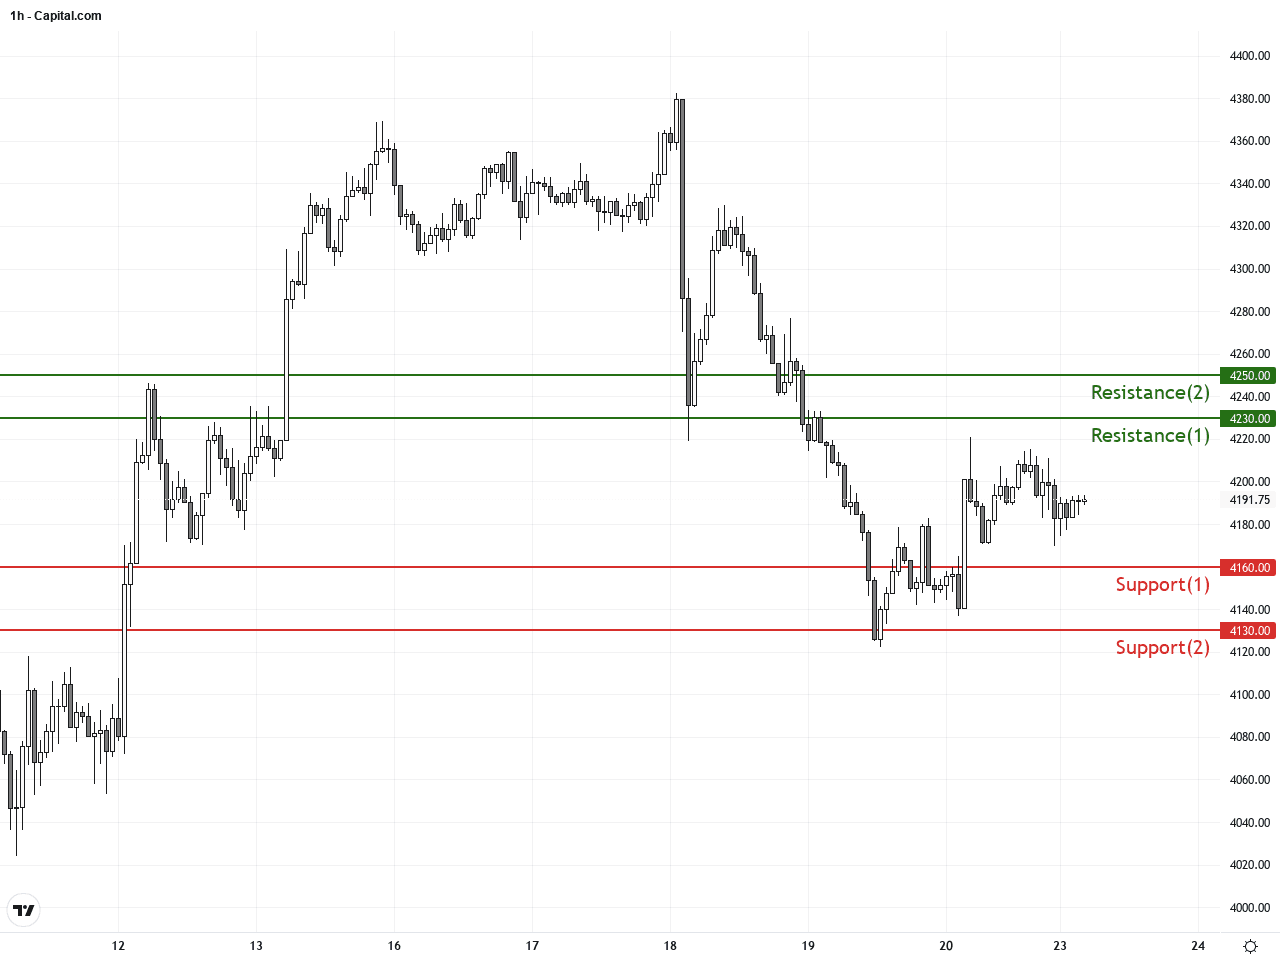
Technically, the daily chart shows a clear downtrend and death cross, with resistance near 4230-4250 and support around 4160. The hourly triangle consolidation suggests a breakout within 24 hours is probable, supported by a forthcoming bullish MACD crossover and a recent bullish engulfing candlestick. A break above resistance could open the door to test 4250, while a failure to hold support at 4160 increases downside risk.Today’s economic calendar includes Poland’s Industrial Producer Prices and Retail Sales data at 09:30 GMT+1, which have limited direct impact on XAUUSD but could influence USD sentiment. At 14:30 GMT+1, Canada’s Core and Total Consumer Price Index will be released, which may impact the dollar and thereby indirectly affect gold prices. No major direct economic events are expected to immediately affect XAUUSD today. Traders should watch European Central Bank and Federal Reserve officials’ speeches later for further clues.
Resistance & Support
The above financial market data, quotes, charts, statistics, exchange rates, news, research, analysis, buy or sell ratings, financial education, and other information are for reference only. Before making any trades based on this information, you should consult independent professional advice to verify pricing data or obtain more detailed market information. 1uptick.com should not be regarded as soliciting any subscriber or visitor to execute any trade. You are solely responsible for all of your own trading decisions.