 |
| Gold V.1.3.1 signal Telegram Channel (English) |
WTI Crude Oil: Breaks Above $80 Amid US-Iran Risk Premium Impact, June 23, 2026
2026-06-23 @ 06:03
Over the past 24 to 48 hours, WTI crude oil prices experienced notable volatility, closing yesterday (June 22, 2026) at $73.86, a clear decline from the previous session. This movement was primarily driven by diplomatic developments between the U.S. and Iran. Recent market news highlighted that the ‘war premium’ on oil prices, which had surged amid heightened US-Iran tensions, started to subside as talks made progress and the Strait of Hormuz reopened. This alleviation of supply disruption fears pushed WTI prices below $74.
At the same time, the U.S. granted a 60-day waiver on Iranian oil sanctions, allowing Iranian crude to re-enter the global market temporarily, boosting supply expectations. This easing of earlier geopolitical supply concerns weighed on oil prices. Additionally, threats of military action from the U.S. president towards Iran caused short-term price swings. For the average investor, these price swings are a vivid reminder of how geopolitical risks directly impact energy markets, with oil prices influenced by political events rather than solely by supply and demand fundamentals. Monitoring the ongoing diplomatic negotiations and U.S. policy moves remains key to anticipating future market moves.
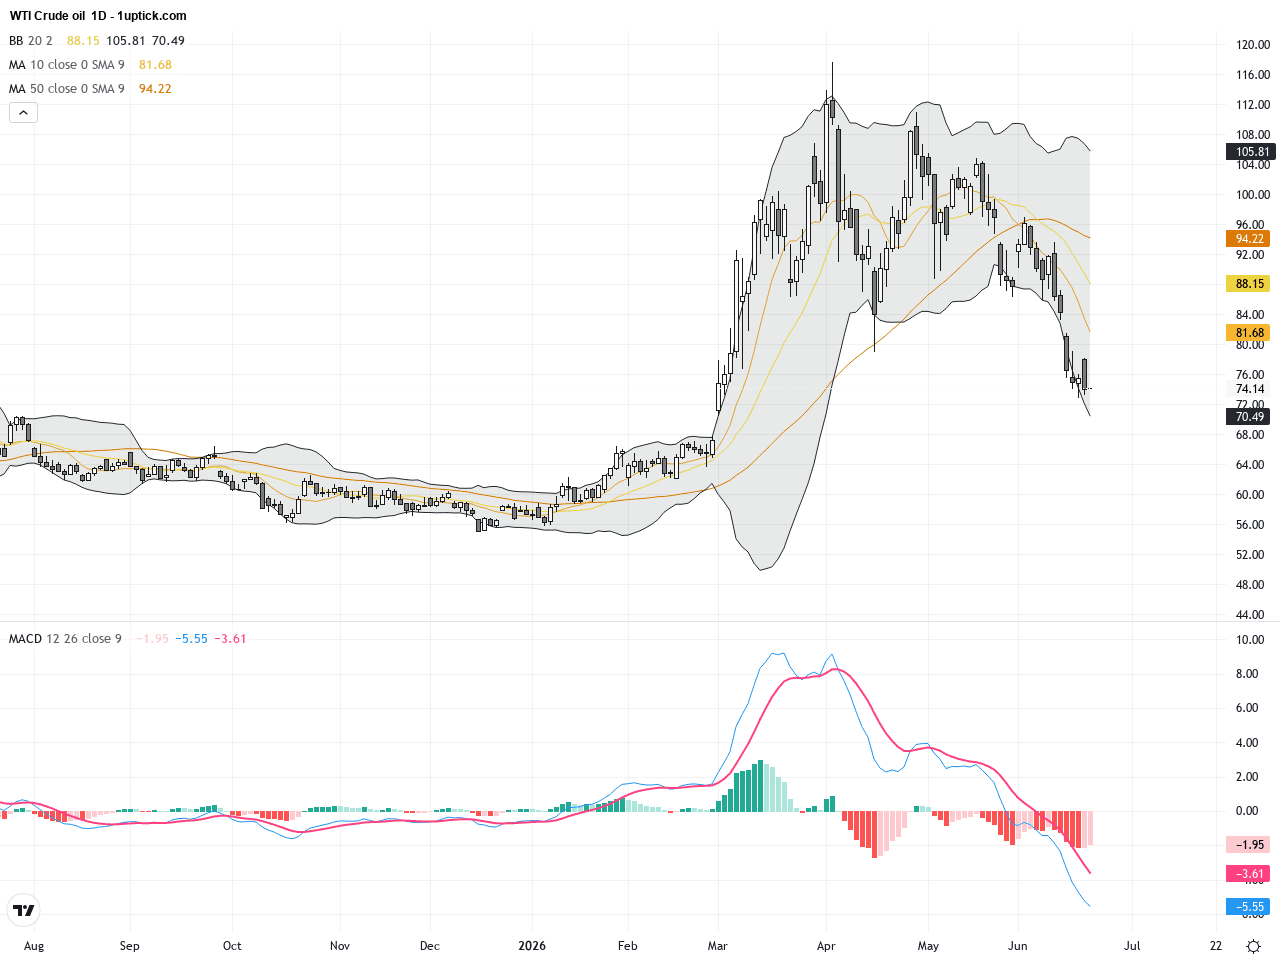
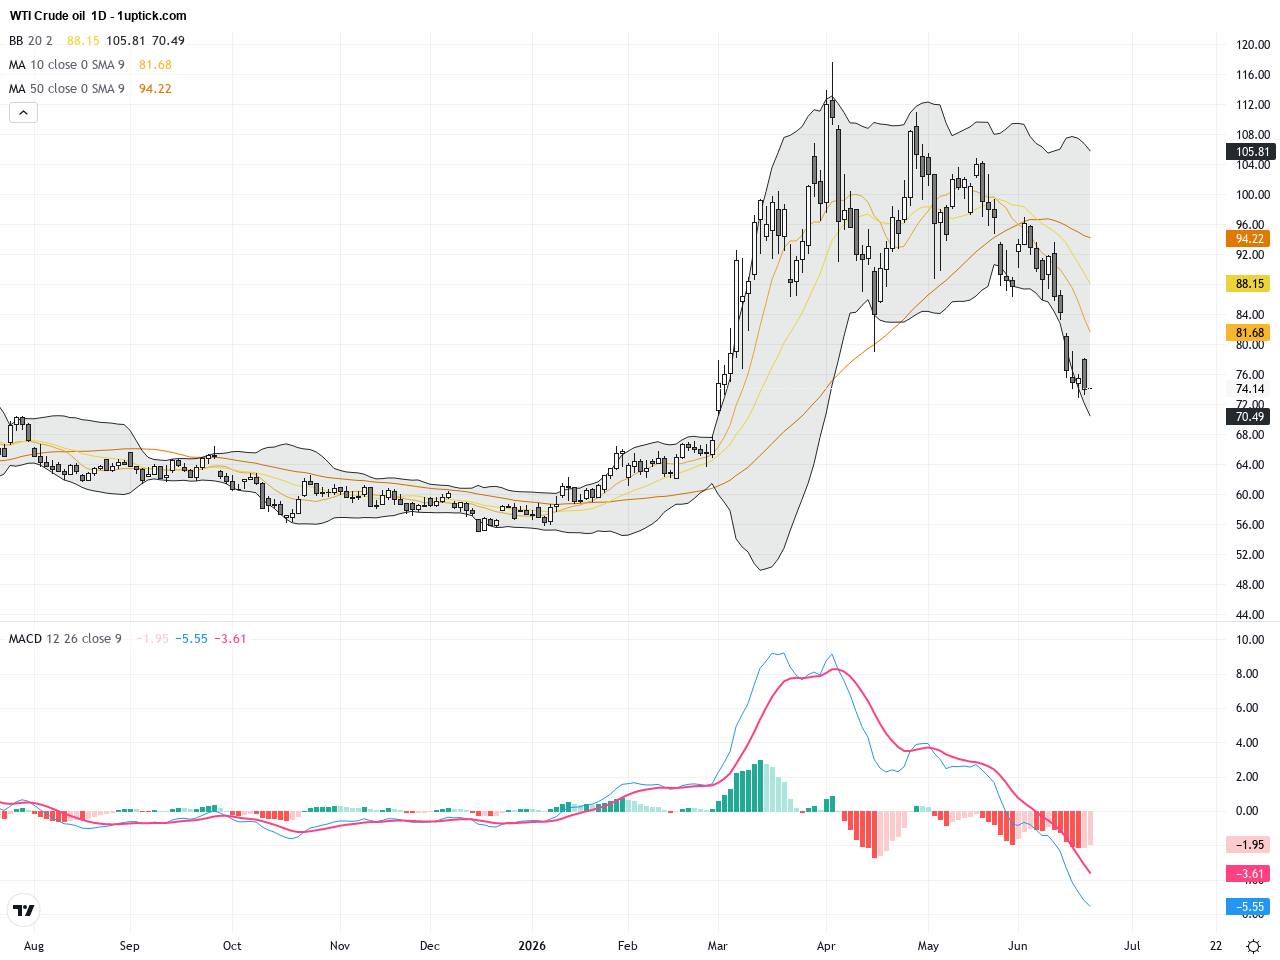
The daily chart shows WTI oil trending downward from late May highs near $90, with a clear downtrend emerging through mid-June, testing support near $73. Prices currently hover around the Bollinger Band midline, showing consolidation rather than directional conviction. The daily MACD indicates weakening momentum with bearish bias, and moving averages confirm a short-to-medium term downtrend. Overall, WTI is in a corrective phase lacking strong bullish impetus.
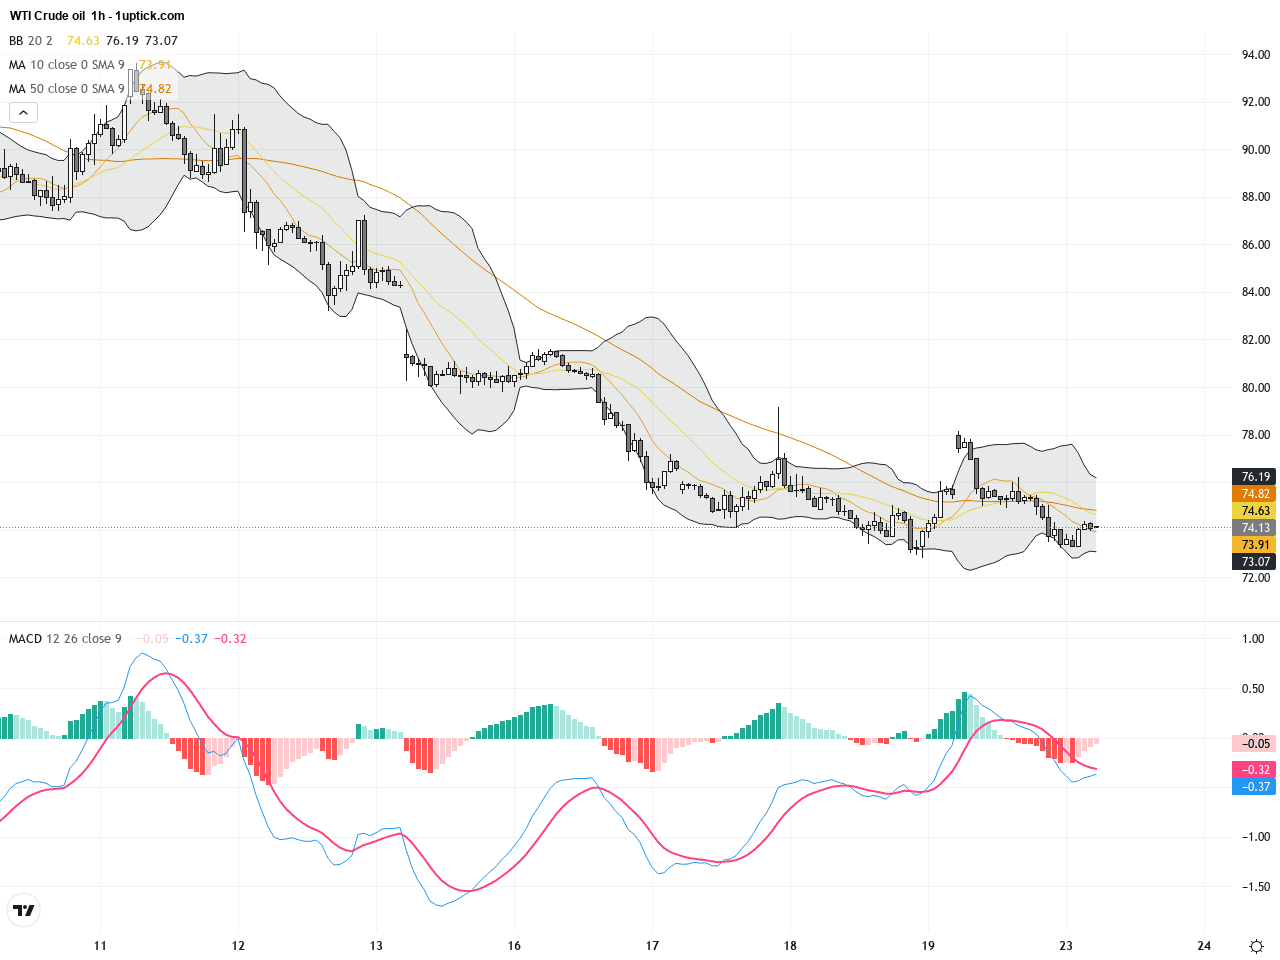
On the hourly chart over the past 3-5 days, WTI displays a gentle upward retracement forming a rising flag pattern. Prices have found support along the 20-period moving average since June 20, while narrowing Bollinger Bands suggest a short-term volatility contraction. The MACD is signalling a bullish crossover at the bottom, indicating potential for short-term rebound. Recent candlesticks include multiple hammer formations, signaling buyers stepping in near support but no decisive confirmation yet.
Technical Trend: WTI Crude Oil is currently in a cautiously bearish consolidation phase, with medium to long-term downtrend intact and short-term rebound attempts underway. Price action is sensitive to geopolitical news flow.
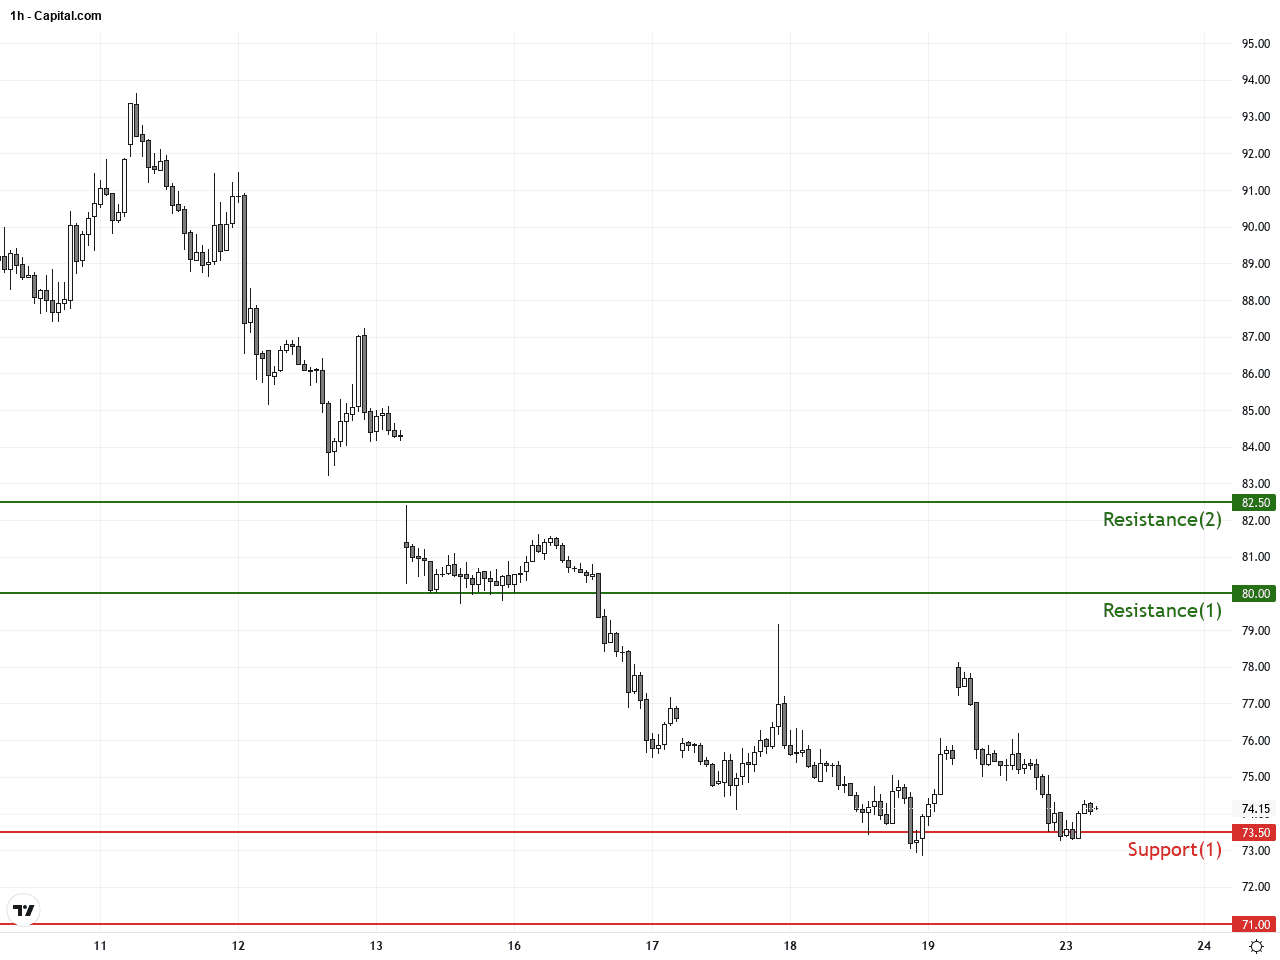
WTI currently faces critical support at $73.5 and resistance at $80. The MACD on the hourly chart shows potential bullish divergence, but the daily chart remains bearish. A short-term bounce is possible, but the overall trend remains cautious and slightly bearish. Traders should monitor US-Iran negotiations closely as a catalyst for price shifts. Volume and momentum changes around the support zone will be key to identify viable long entries or to confirm continued downside risk.There are no significant or direct economic events scheduled today (GMT+1) that would impact WTI Crude Oil prices. Price action is expected to be driven predominantly by geopolitical developments and market sentiment rather than fundamental data releases.
Resistance & Support
Run Live WTI Crude Oil Analysis
The above financial market data, quotes, charts, statistics, exchange rates, news, research, analysis, buy or sell ratings, financial education, and other information are for reference only. Before making any trades based on this information, you should consult independent professional advice to verify pricing data or obtain more detailed market information. 1uptick.com should not be regarded as soliciting any subscriber or visitor to execute any trade. You are solely responsible for all of your own trading decisions.