 |
| Gold V.1.3.1 signal Telegram Channel (English) |
USDCAD: Holding Above 1.4200 Key Support Signals Bullish Momentum, June 30, 2026
2026-06-30 @ 13:01
Over the past 48 hours, the USD/CAD currency pair has hovered steadily around the 1.42 level, closing yesterday at 1.42364, marking a slight gain from the previous day. This movement underscores the market’s ongoing recognition of the US dollar’s strength, while investors remain attentive to easing geopolitical risks and fluctuations in oil prices.
Recent market news reveals that the USD/CAD retains a bullish tone despite a modest dip in oil prices. US inflation data showed a muted reaction, which tempered volatility. Additionally, Citi raised its USD/CAD target to 1.43, signaling sustained long-term support for the dollar. The currency pair has surged from below 1.36 to above 1.42 in recent months, with some analysts, including Commerzbank, suggesting the current valuation might be somewhat overstretched.
For the average investor, this appreciation signals increased global demand for the US dollar as a safe-haven asset amidst fluctuating oil prices and reduced geopolitical tensions. Although the Canadian dollar typically correlates closely with oil, the recent lack of strong rebound in oil prices has restrained the loonie’s recovery, allowing the US dollar to maintain its upper hand.
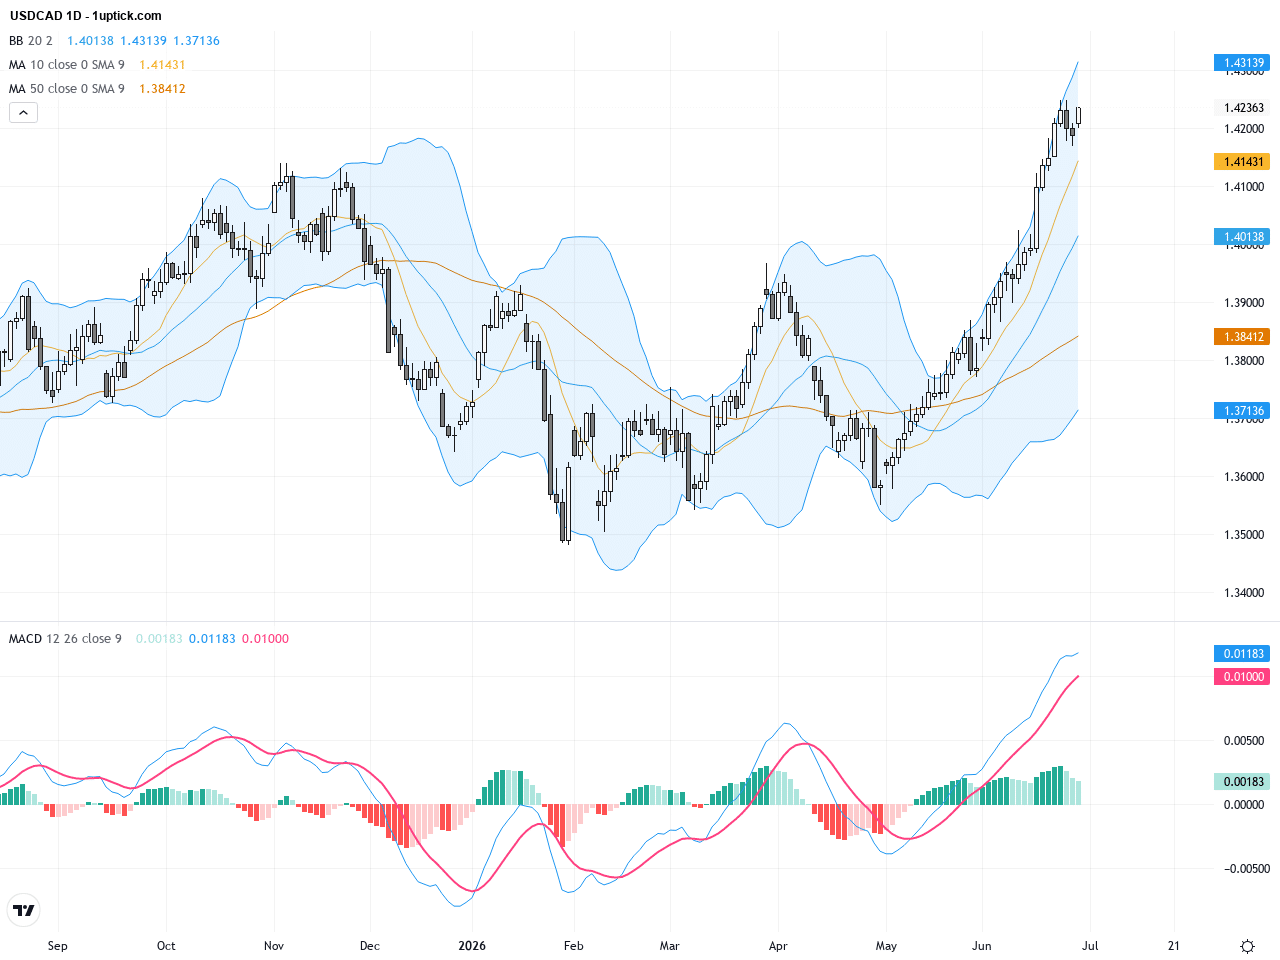
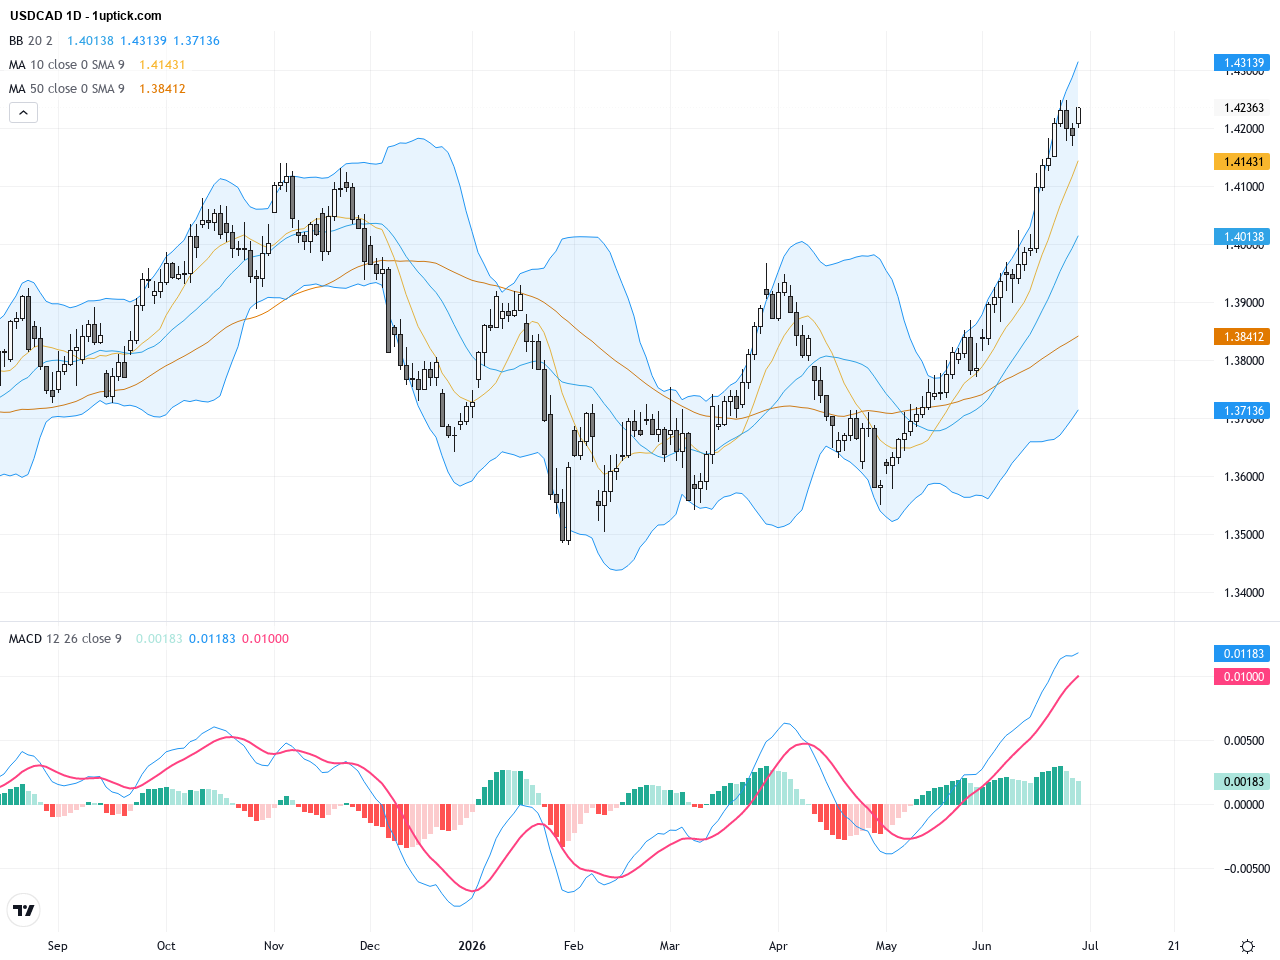
The daily chart shows a steady uptrend from the 1.3600 area toward levels above 1.42. The 50-day and 200-day moving averages exhibit a bullish crossover with price trading above both, reinforcing the continuation of the upward trend. Bollinger Bands display price near the upper band indicating buying strength but heightened short-term volatility. The MACD remains in positive territory with a slight contraction in histogram height, suggesting that bullish momentum is still present but could be moderating.
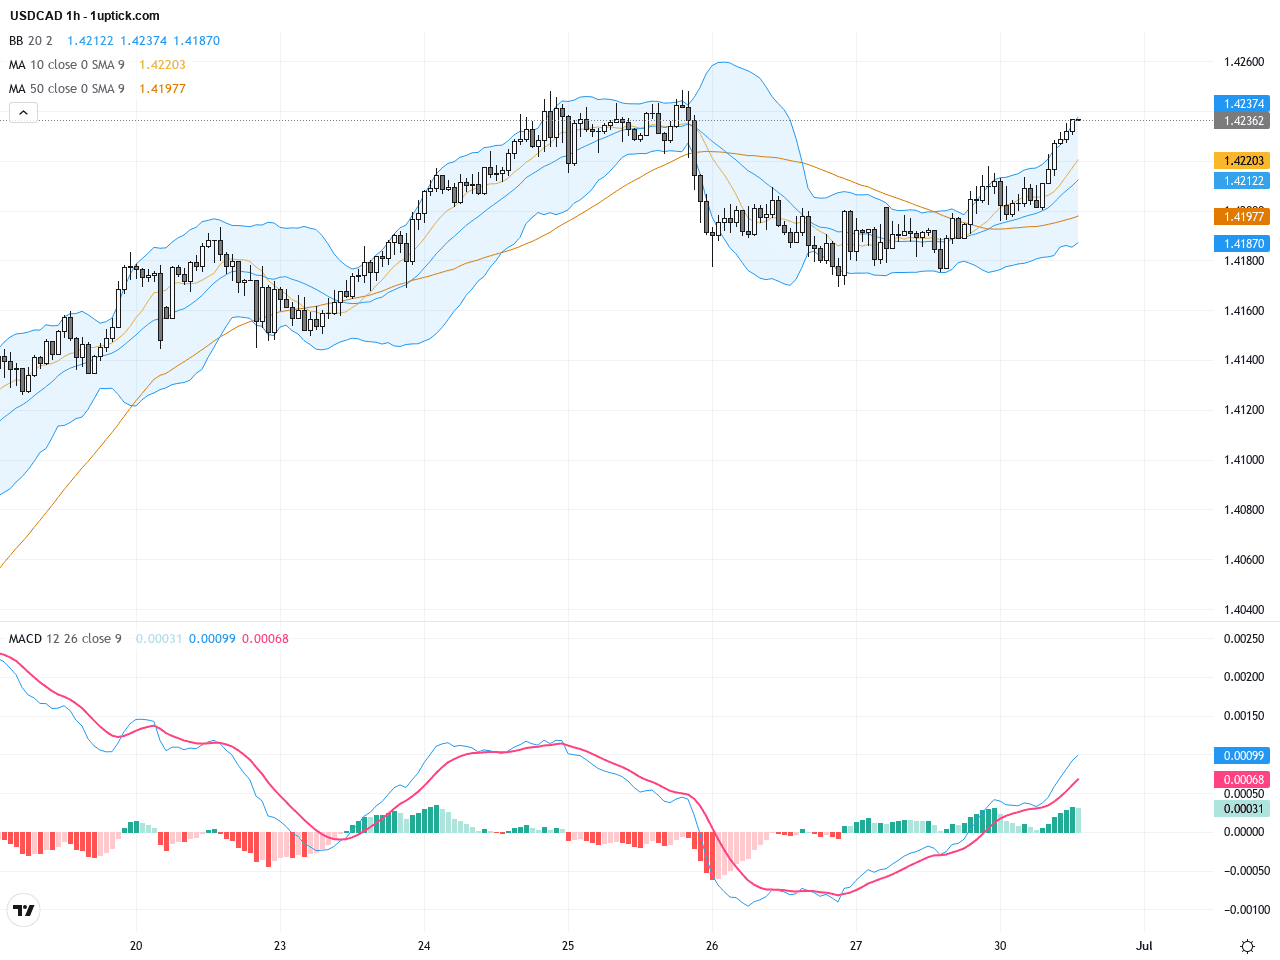
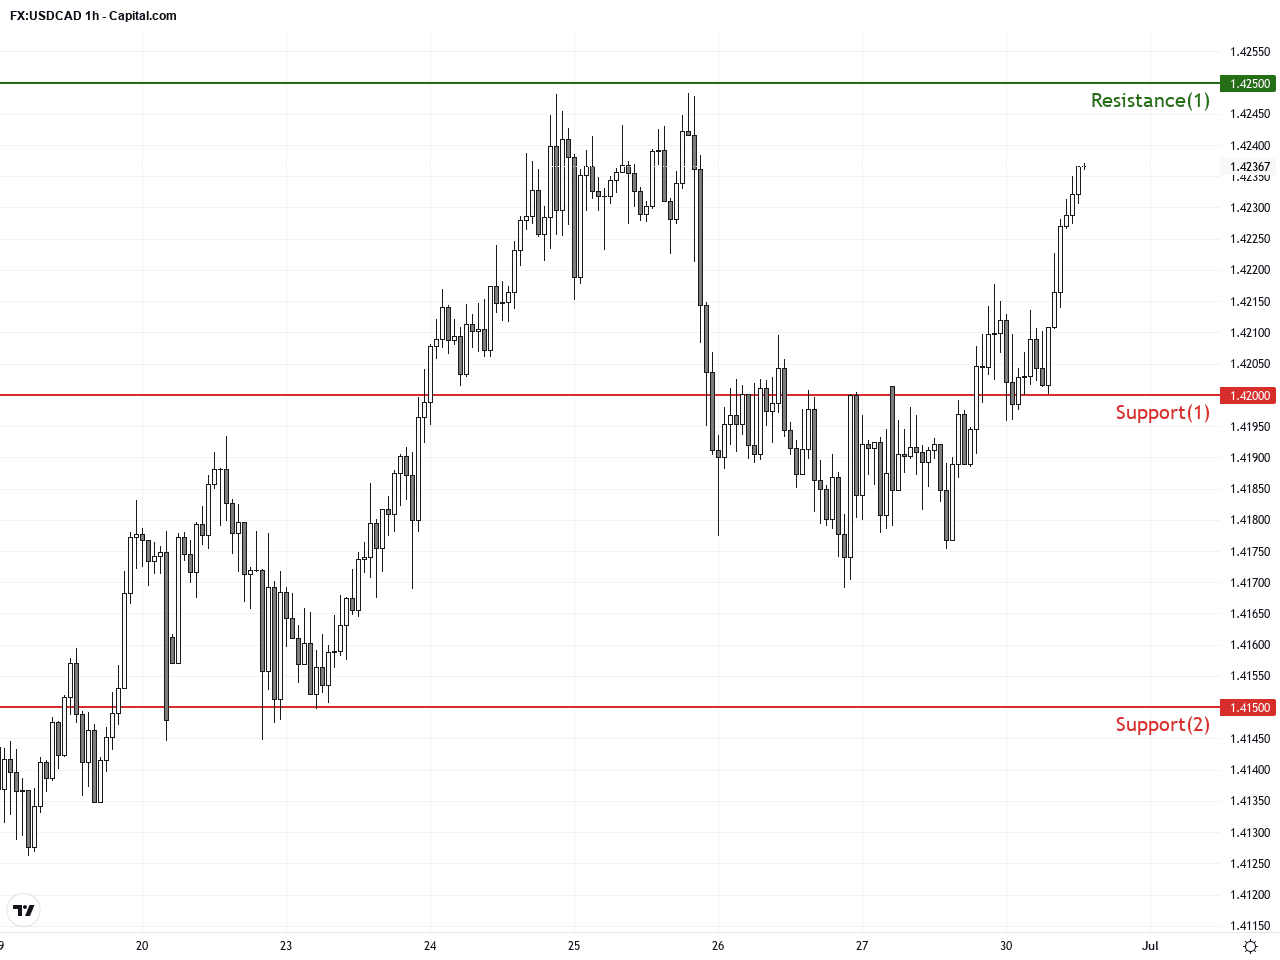
On an hourly basis over the past 3 to 5 days, USDCAD shows a minor pullback toward the 1.4150 zone before reclaiming the 1.4200 support level multiple times. The short-term moving averages (20 and 50) recently formed a golden cross, hinting at potential renewed bullish momentum. Narrowing Bollinger Bands signal a possible breakout from the current range. The MACD lines have recently crossed several times, reflecting increased volatility and a potential inflection point.
Technical Trend: The overall trend is cautiously bullish, with bulls holding the upper hand despite short-term consolidation and momentum moderation.
Technical analysis reveals sustained bullish support in USDCAD, although the contraction in MACD histogram and tightening Bollinger Bands imply momentum expansion may slow. Recent price action consolidates between 1.4150 and 1.4230, showing balanced forces between bulls and bears. Traders should watch for short-term moving average crossovers and RSI divergences as key signals for the next directional move.There are no major economic releases today directly impacting USD/CAD. Canada’s monthly GDP data for April is scheduled at 14:30 GMT+1 (22:30 HKT), with a forecast of 0.4%, potentially influencing the Canadian dollar but outside of current trading hours. Other international data such as Japan’s unemployment rate and China’s manufacturing PMI are scheduled but have limited direct impact on the USD/CAD pair today. Short-term price moves will be more driven by US dollar strength and oil price developments.
Resistance & Support
The above financial market data, quotes, charts, statistics, exchange rates, news, research, analysis, buy or sell ratings, financial education, and other information are for reference only. Before making any trades based on this information, you should consult independent professional advice to verify pricing data or obtain more detailed market information. 1uptick.com should not be regarded as soliciting any subscriber or visitor to execute any trade. You are solely responsible for all of your own trading decisions.