 |
| Gold V.1.3.1 signal Telegram Channel (English) |
GBPUSD: Key Head and Shoulders Pattern Approaching Critical Decision Point – Trading Outlook & Support Resistance, June 3, 2026
2026-06-03 @ 13:03
Over the past 24 to 48 hours, GBP/USD has exhibited relatively limited volatility, closing near 1.3459, slightly down from the previous day’s close of 1.3465. The market remained cautious due to ongoing uncertainty in US-Iran relations, causing the British pound to trade within a narrow range.
Recent headlines highlight that the Pound is approaching a critical decision point, with the GBP/USD chart forming a well-defined head and shoulders pattern, awaiting a confirmed breakout. Meanwhile, the US dollar index held steady around 99.06 amid an extended US-Iran ceasefire, maintaining dollar strength that capped the Pound’s upside. On the UK front, higher unemployment data combined with tempered expectations for further BoE rate hikes have added pressure on the pound.
For the average investor, this period feels like a tug of war. Global political risks act as gusts strengthening the safe-haven dollar, while the pound remains stuck on the sidelines without clear direction. GBP holders should stay patient for more macro cues before a definitive price move emerges.

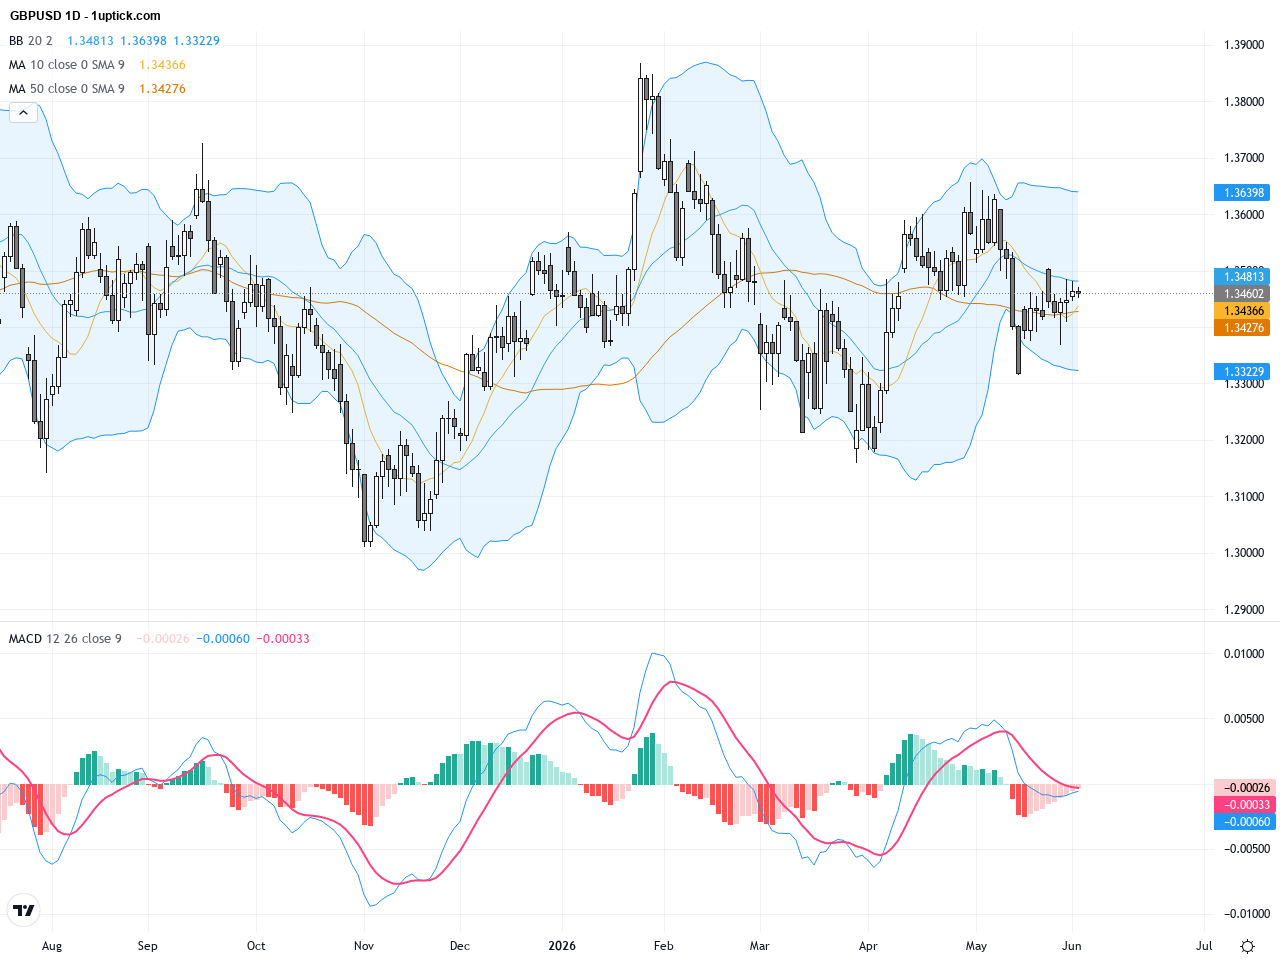
The daily chart shows GBPUSD oscillating at higher levels throughout the year, with recent price consolidating between 1.34 and 1.35. The 50 and 200-day moving averages are intertwined, indicating no clear long-term trend. The head and shoulders pattern began forming in mid-May with the left shoulder and head near 1.36 and 1.38 respectively. Last week’s right shoulder formed quickly before a sharp decline. Multiple attempts to hold the neckline near 1.3440 have created resistance, suggesting a risk of further downside if broken.
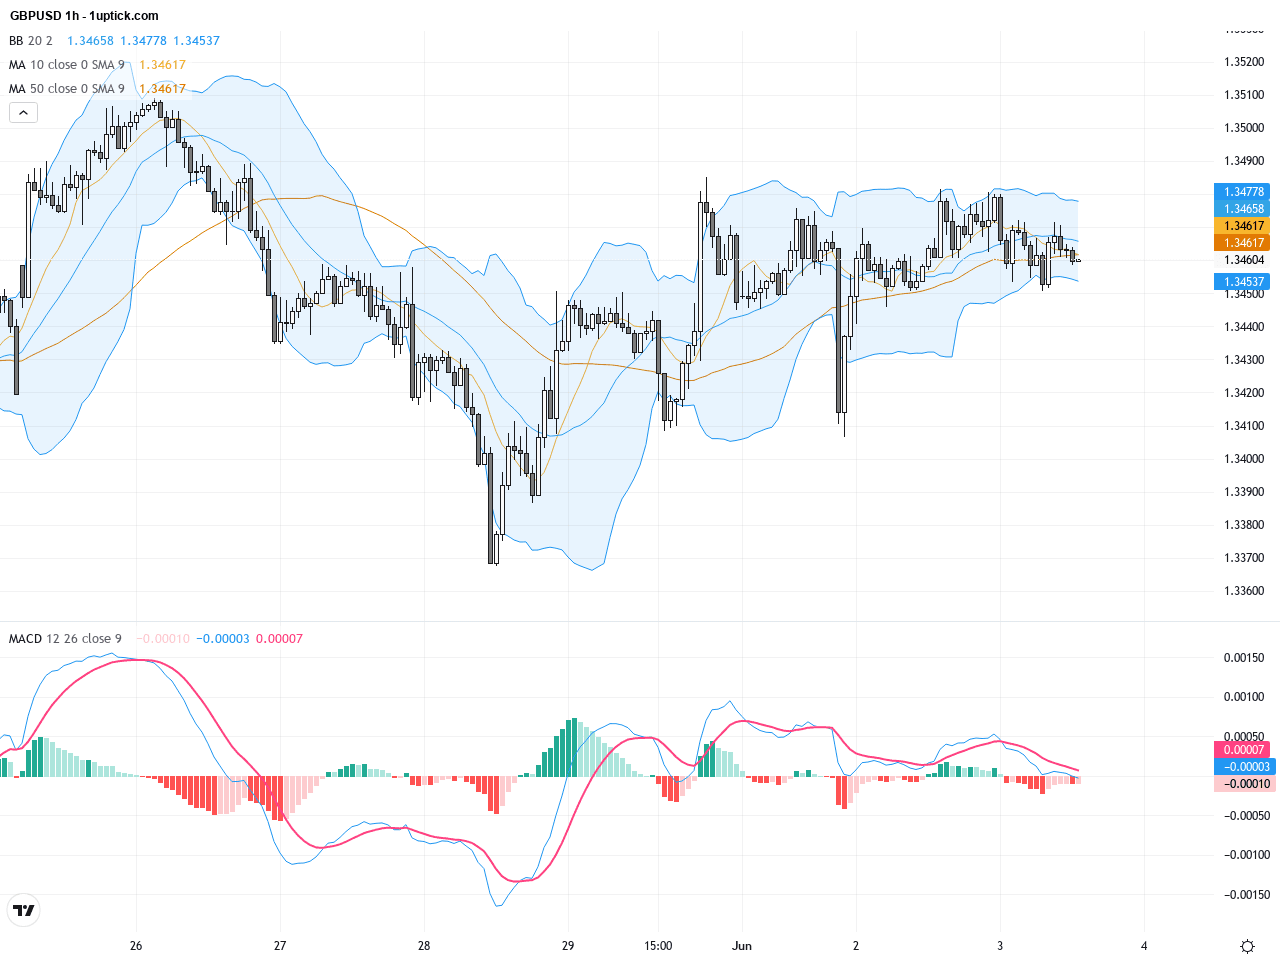
On the hourly chart covering the past 3-5 days, GBPUSD has moved sideways between 1.3430 and 1.3470. The Bollinger Bands are contracting, indicating reduced volatility. The MACD sits slightly negative but is close to a bullish crossover. A recent hammer candlestick with a long lower shadow points to short-term buying support. A breakout above 1.3475 resistance could see bulls regain control in the near term.
Technical Trend: GBPUSD is currently in a cautious sideways consolidation with technical patterns indicating a potential upcoming trend reversal. Volatility could increase as price nears key levels.
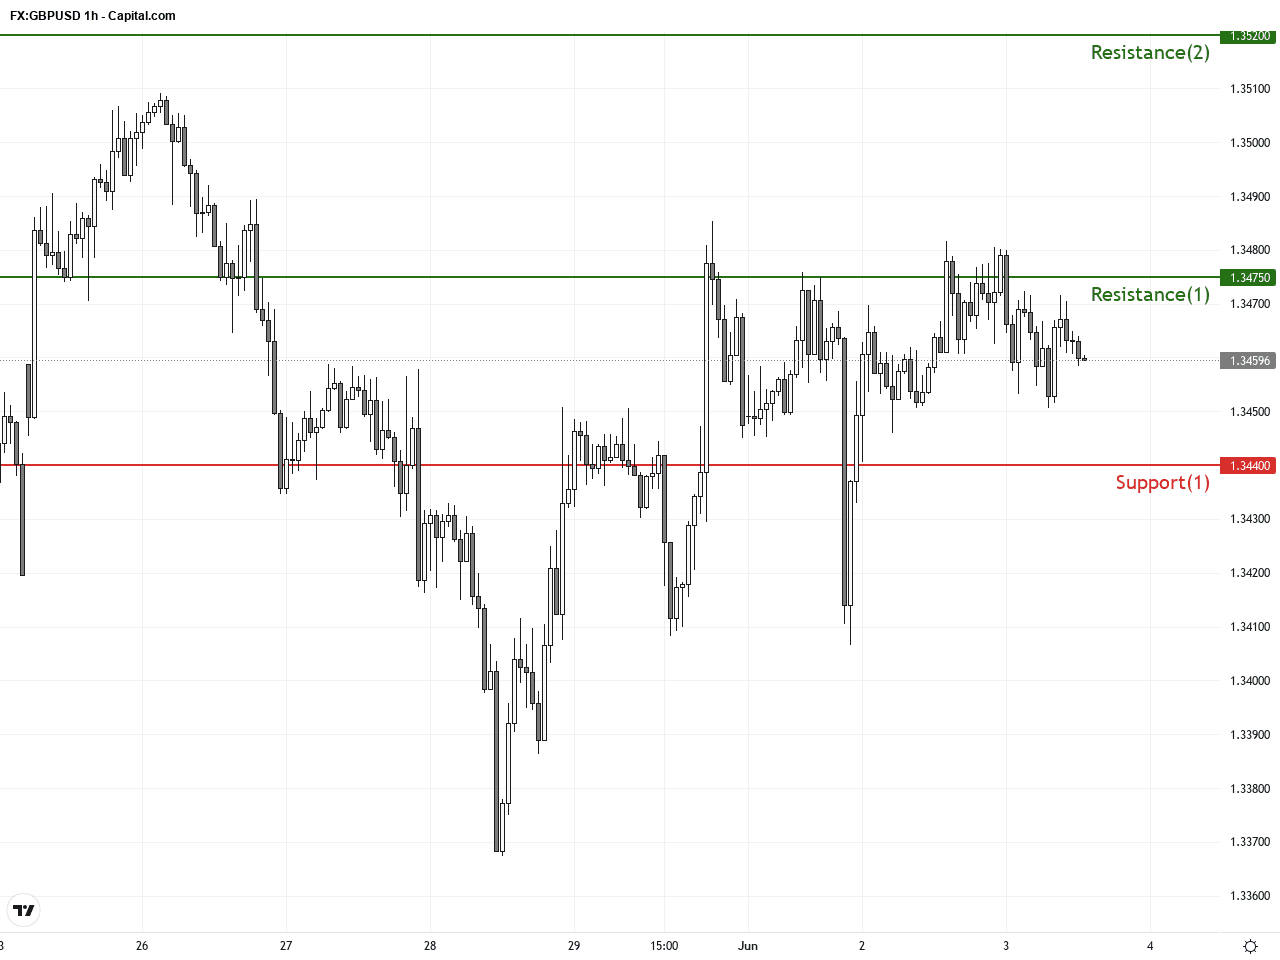
Technically, the head and shoulders pattern continues to weigh on GBPUSD with a confirmed break below the 1.3440 neckline signaling potential for further declines towards the 1.3300 support zone. A possible MACD bearish crossover adds to downside momentum. Conversely, a strong hold of the neckline and break above 1.3475 could rejuvenate bulls and present a buying opportunity. Traders should watch these levels closely for trade setups.Today’s economically relevant data for GBPUSD is the UK finalized Services PMI for May (forecast 47.9 vs previous 52.7), signaling a slowdown in UK economic activity that may weigh on the pound. Additionally, softer-than-expected EU and German services PMIs could increase relative sterling weakness. Hence, the short-term economic outlook remains bearish, likely putting pressure on GBPUSD.
Resistance & Support
The above financial market data, quotes, charts, statistics, exchange rates, news, research, analysis, buy or sell ratings, financial education, and other information are for reference only. Before making any trades based on this information, you should consult independent professional advice to verify pricing data or obtain more detailed market information. 1uptick.com should not be regarded as soliciting any subscriber or visitor to execute any trade. You are solely responsible for all of your own trading decisions.