


 |
| Gold V.1.3.1 signal Telegram Channel (English) |
AUDUSD: Bullish Momentum Builds Amid Key Support and Resistance Levels, June 3, 2026
2026-06-03 @ 06:03
Over the past 24 to 48 hours, the AUD/USD has maintained its positive momentum, closing yesterday at 0.71791 and holding steady within its recent trading range. Australia’s upcoming Q1 GDP release is highly anticipated by the market, seen as a critical driver for the currency’s next movement. Changes in Australian yield spreads continue to influence price action, with investors closely watching the Federal Reserve (Fed) and Reserve Bank of Australia (RBA) policy outlooks for direction.
The Australian dollar has shown some risk adjustment against the New Zealand dollar, with analysts suggesting further downside potential due to shifts in New Zealand’s economic data and rate expectations. Nevertheless, the AUD/USD pair remains supported in the short term, buoyed by hawkish expectations on the RBA, keeping the pair comfortably above the 0.72 level at times.
For the average investor, this period resembles awaiting the results of an important exam—the impending GDP numbers will offer vital insights into Australia’s economic health and guide decisions about holding or adjusting exposure to the Australian dollar. The current scenario underscores the importance of closely monitoring the GDP release and the evolving policy divergence between the Fed and RBA, which could significantly impact market volatility going forward.
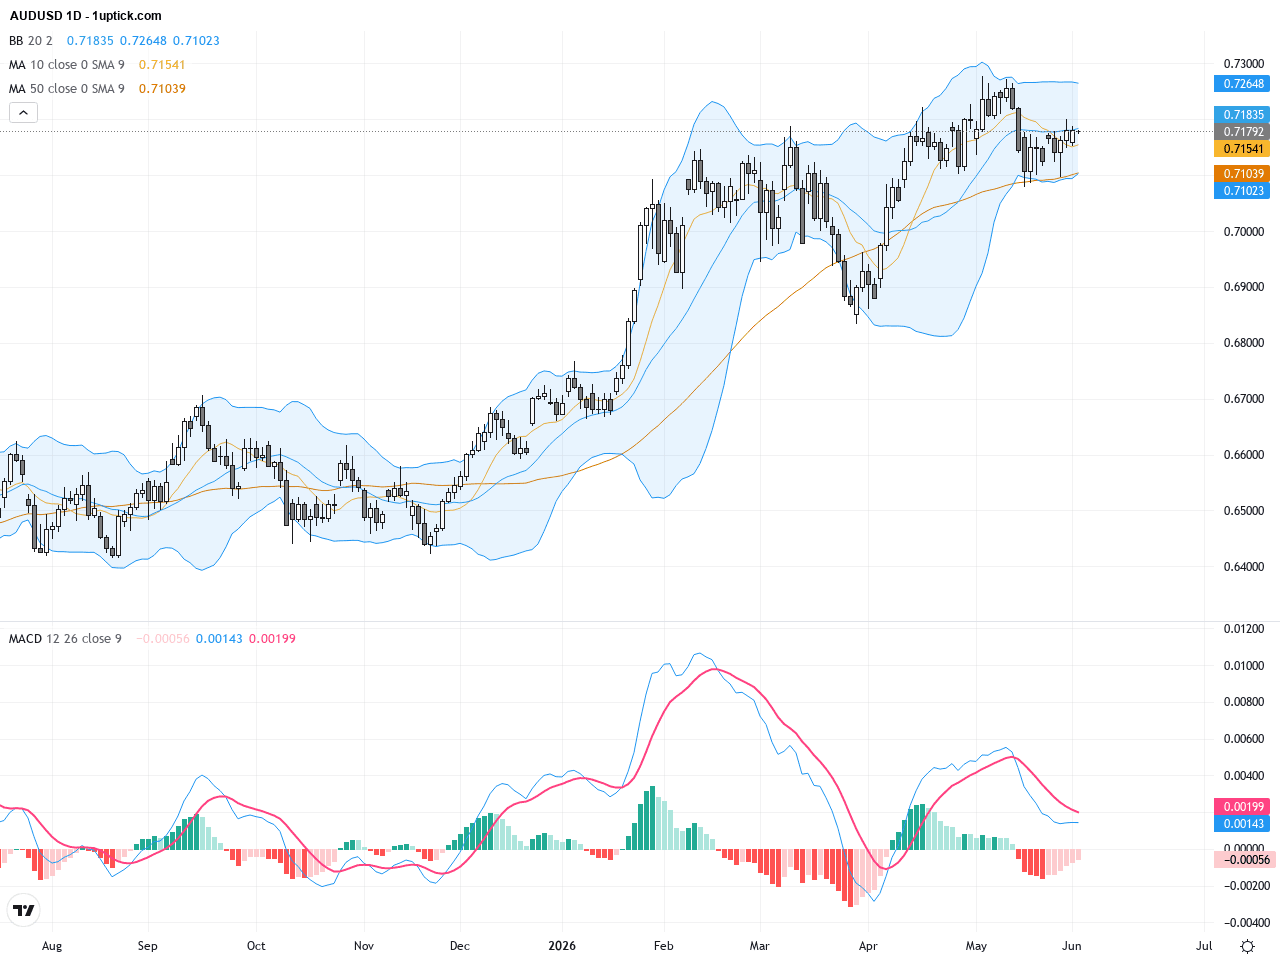
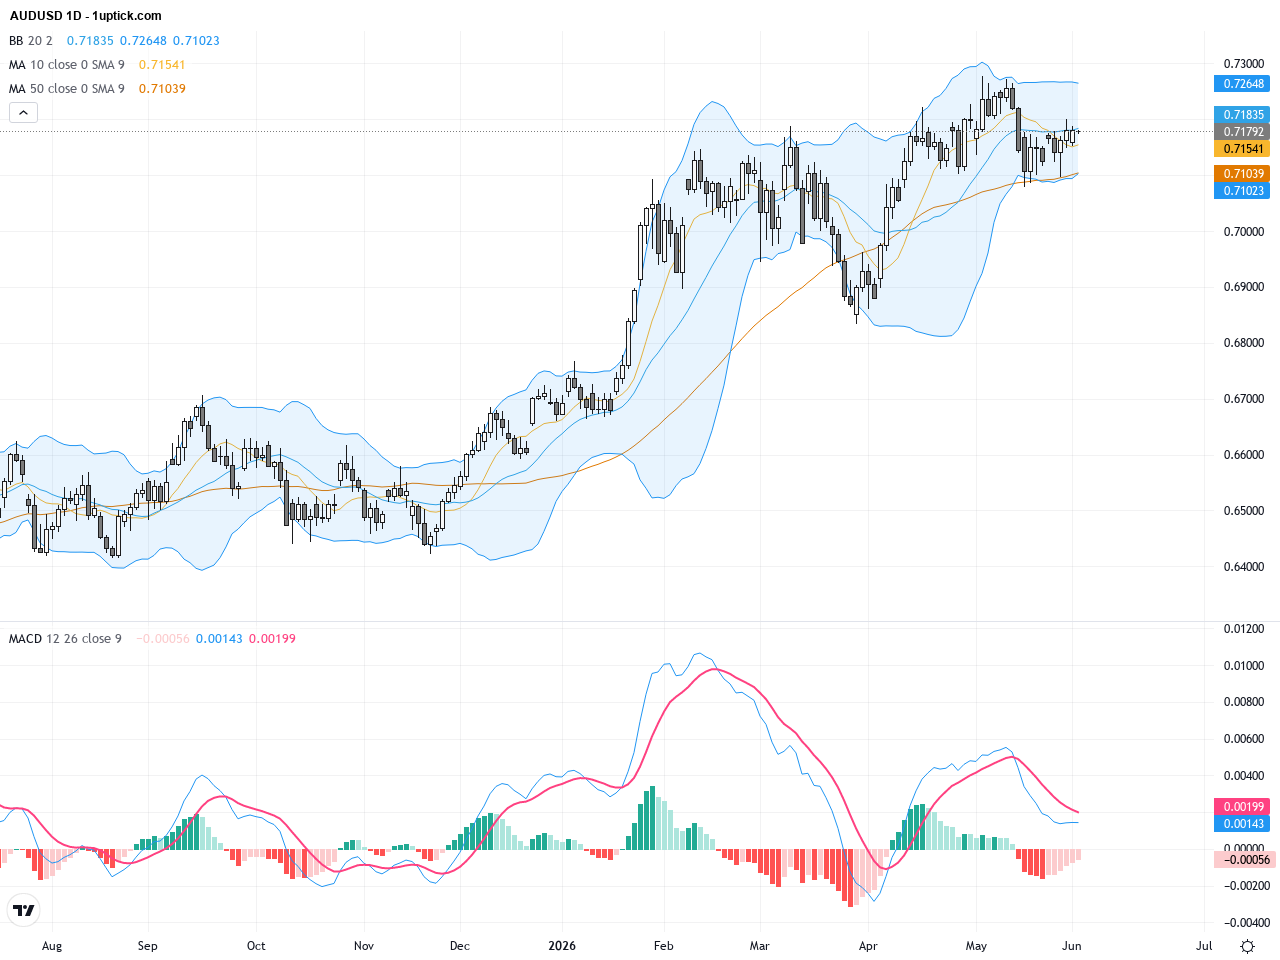
The daily chart shows a steady upward trend on AUDUSD with prices mostly trading above the 50-day moving average (~0.7147), signaling sustained medium-to-long-term bullish momentum. Bollinger Bands reveal increasing volatility with prices pressing towards the upper band. The MACD remains above zero with the fast line diverging positively from the slow line, confirming strong buying interest. Overall, the daily technicals support further upside toward the yearly high at 0.72776.
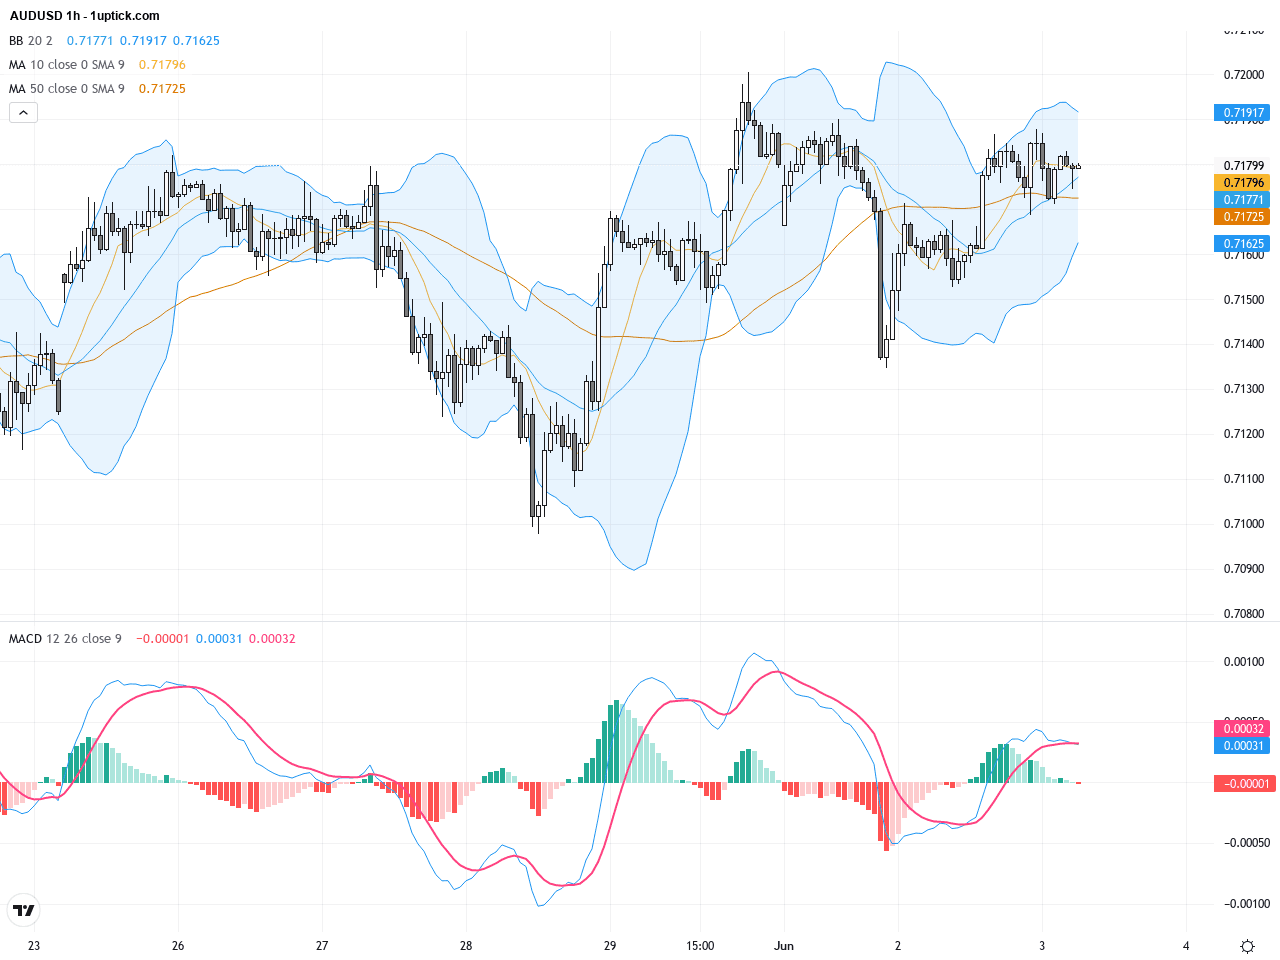
On the hourly chart over the past 3–5 days, AUDUSD has traded in a slight consolidation pattern with small upward pushes. Prices hover near the 20- and 50-period moving averages, with Bollinger Bands tightening and showing early expansion upward, indicating elevated short-term volatility. A recent bullish MACD crossover accompanied by increased volume suggests a probable short-term rally. Multiple medium-sized bullish candlesticks reinforce short-term buying dominance, with the 0.7200 psychological level posing immediate resistance.
Technical Trend: Cautiously Bullish Trend
Technically, AUDUSD remains in an ongoing bullish trend. A dominant pattern on the daily chart shows rising support levels and higher lows indicating solid buyer interest. The recent hourly MACD bullish crossover combined with price breaking above the mid-Bollinger band suggests short-term upside momentum to test the 0.7200 resistance level. A key bullish engulfing candlestick pattern signals strong positive sentiment for the next 24 hours. Overall, the market tone is optimistic though traders should stay alert to possible USD-driven fluctuations.There are no major direct economic events scheduled today that would immediately impact AUDUSD. Australian data releases including the Current Account and Business Inventories for Q1 will be published at 03:30 GMT+1, but limited market movement is expected. Other minor US and global economic events are unlikely to trigger significant AUDUSD volatility today. Attention remains on Australia’s forthcoming GDP figure as the main driver for future price action.
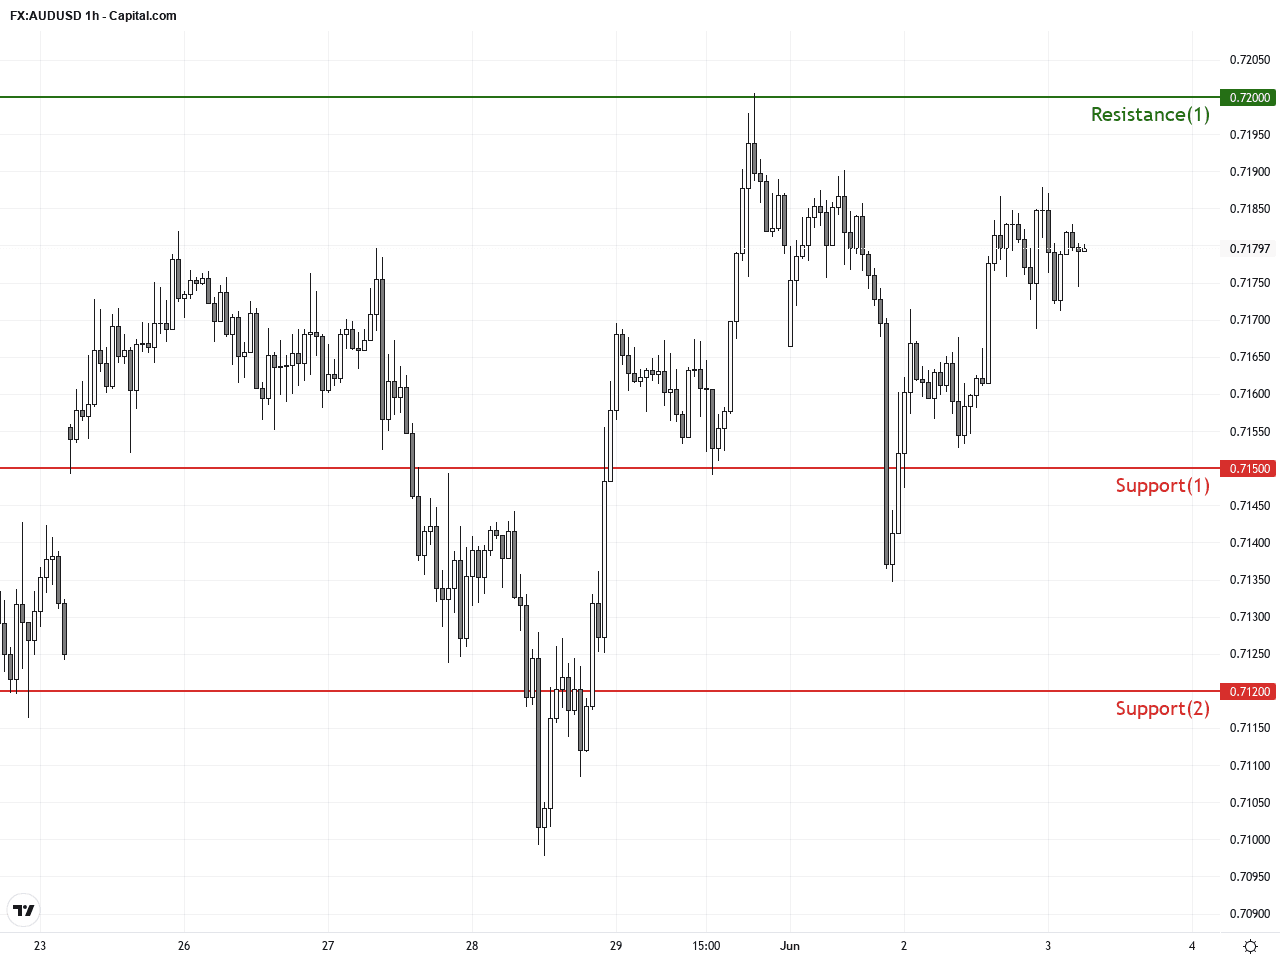
Resistance & Support
The above financial market data, quotes, charts, statistics, exchange rates, news, research, analysis, buy or sell ratings, financial education, and other information are for reference only. Before making any trades based on this information, you should consult independent professional advice to verify pricing data or obtain more detailed market information. 1uptick.com should not be regarded as soliciting any subscriber or visitor to execute any trade. You are solely responsible for all of your own trading decisions.