


 |
| Gold V.1.3.1 signal Telegram Channel (English) |
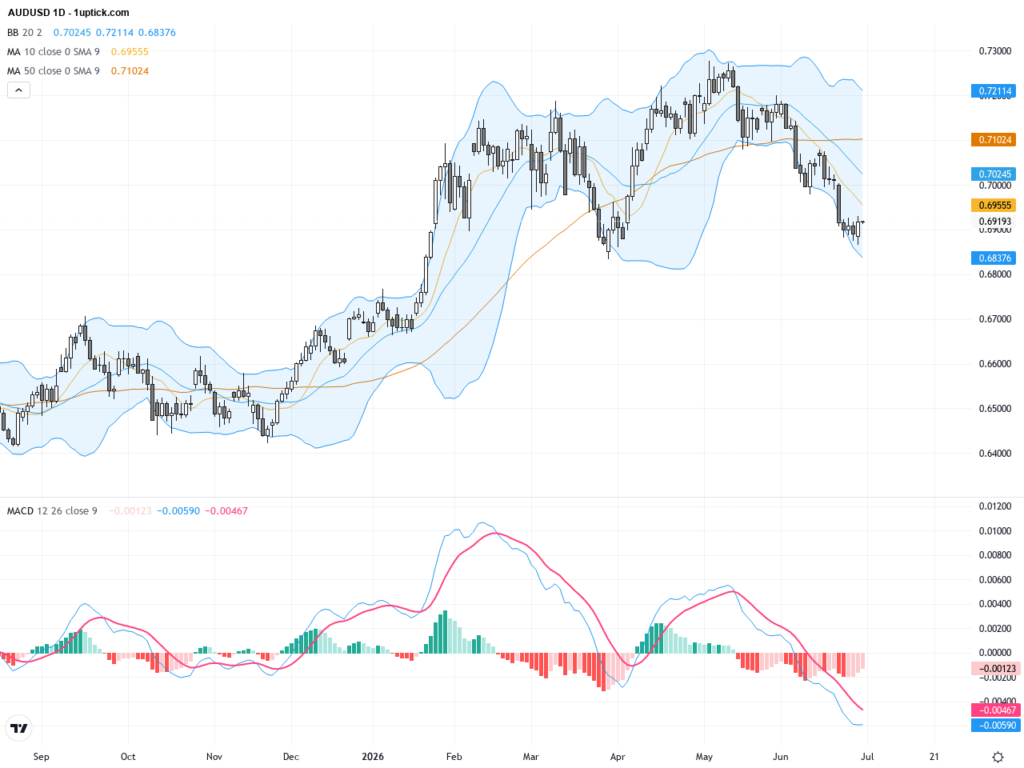
AUDUSD: US Dollar Strength Pushes Pair to 11-Week Low, Key Technical Support Tested, July 1, 2026
2026-07-01 @ 06:01
Over the past 48 hours, the AUD/USD currency pair has experienced a notable decline, dropping to an 11-week low near 0.6899, down from yesterday’s close of 0.69192. The primary driver behind this movement is the broadly strengthening US dollar, with the DXY index hovering close to 101, intensifying dollar demand and weakening alternative currencies including the Australian dollar. Meanwhile, Japan’s weak domestic environment keeps the yen subdued, adding to global currency volatility. As a risk-sensitive currency, the AUD bears the brunt of rising US economic optimism and heightened risk-off sentiment worldwide.
The latest Australian Consumer Price Index (CPI) release gave mixed signals and failed to provide robust support for the AUD. Furthermore, markets are closely watching the Reserve Bank of Australia’s (RBA) upcoming minutes for clues on the future interest rate path. Against this backdrop, the exchange rate reflects investors recalibrating their outlook on global economic risks and inflation expectations. For an everyday investor, holding AUD assets means facing declines due to dollar strength, prompting a more cautious approach toward future trades.

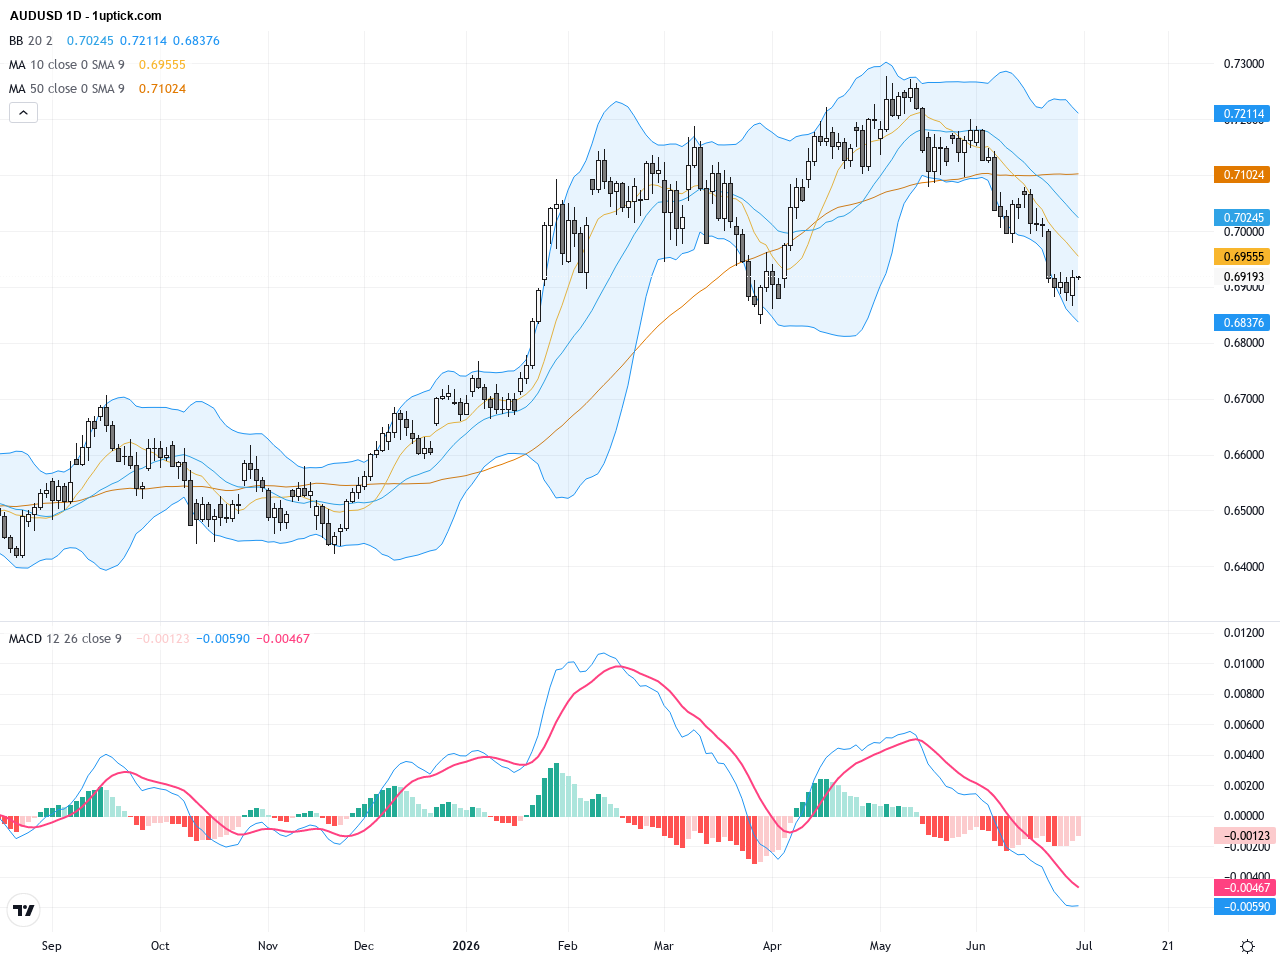
The daily chart reveals a clear bearish structure for AUDUSD, with price having broken below the 50-day moving average and now testing the 200-day EMA for support. Bollinger Bands are expanding with price hugging the lower band, signaling increased volatility and dominant selling pressure. The MACD remains in negative territory with its moving averages below zero, confirming a sustained downtrend. Although a hammer candlestick hints at a possible short-term pause, the overall technical setup favors further downside. Monitoring the 200-day EMA near 0.6849 will be crucial to determine if the support holds or breaks.
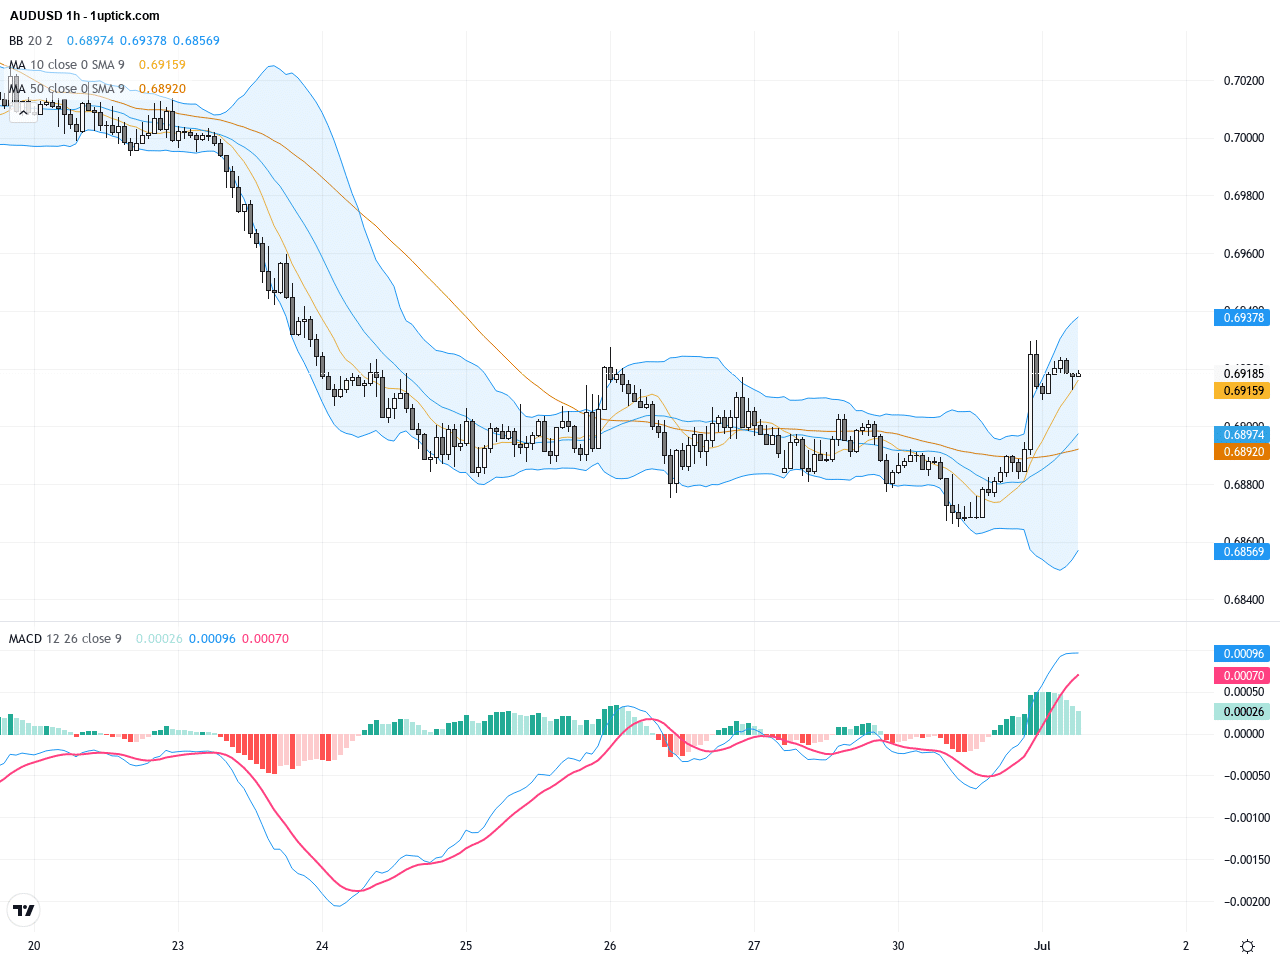
On the hourly chart covering the last 3-5 days, AUDUSD has been trading below its short-term moving averages, confirming a bearish bias. The 20-hour MA lies above current price, acting as resistance. Bollinger Bands are tightening, indicating a potential upcoming breakout. MACD is approaching a bearish crossover while volume declines, suggesting weakening momentum. A recent bearish engulfing candlestick reinforces selling sentiment in the shorter timeframe, pointing towards continued downward pressure unless a clear reversal signal emerges.
Technical Trend: Cautiously Bearish
Technically, AUDUSD is testing major support near the 200-day EMA on the daily chart; a break below this level could accelerate bearish momentum. The hourly chart’s MACD is nearing a death cross, paired with a bearish engulfing pattern, signaling short-term sellers’ dominance. The price currently resides near the lower Bollinger Band, reflecting negative market sentiment. Declining volume suggests hesitation, possibly foreshadowing a temporary pullback, yet the dominant trend remains bearish. Traders should look for confirmation from momentum indicators before taking positions.Today’s GMT+1 calendar highlights several important events. Notably, Australia’s RBA minutes and private sector credit data are scheduled at 03:30, representing key drivers for AUDUSD. Japan’s unchanged unemployment rate and industrial production were already released with stable results, while China’s manufacturing and services PMI slightly exceeded forecasts, having limited immediate impact on AUD. Overall, the focus remains on Australian data, where hawkish tones in the RBA minutes could support a bounce in AUDUSD, whereas dovish signals might exacerbate weakness.
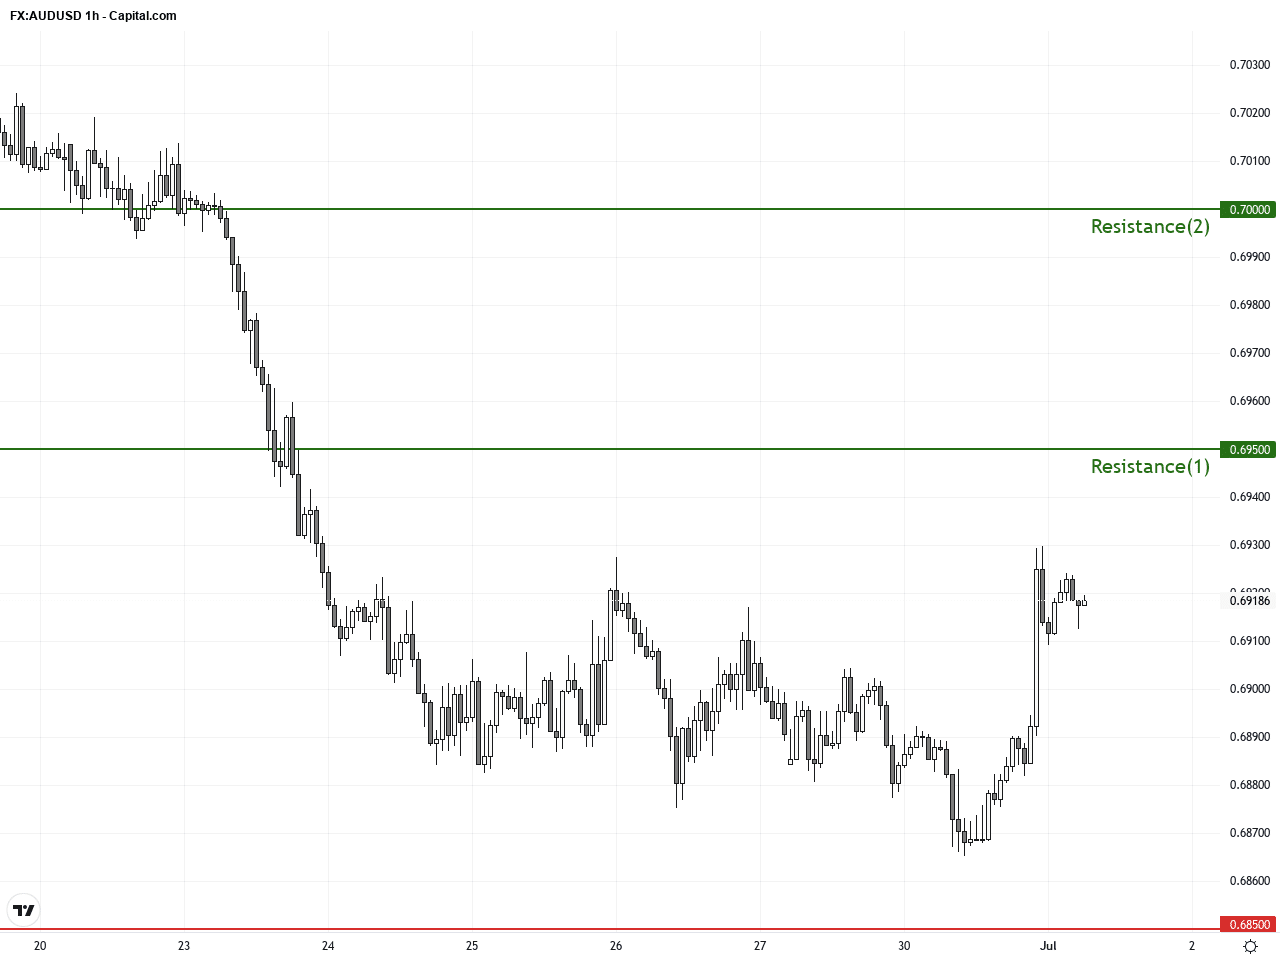
Resistance & Support
The above financial market data, quotes, charts, statistics, exchange rates, news, research, analysis, buy or sell ratings, financial education, and other information are for reference only. Before making any trades based on this information, you should consult independent professional advice to verify pricing data or obtain more detailed market information. 1uptick.com should not be regarded as soliciting any subscriber or visitor to execute any trade. You are solely responsible for all of your own trading decisions.