









 |
| Gold V.1.3.1 signal Telegram Channel (English) |
USDJPY Technical Pivot: Key Support and Resistance amid Yen Intervention and Market Volatility, August 14, 2026
2026-08-14 @ 11:01
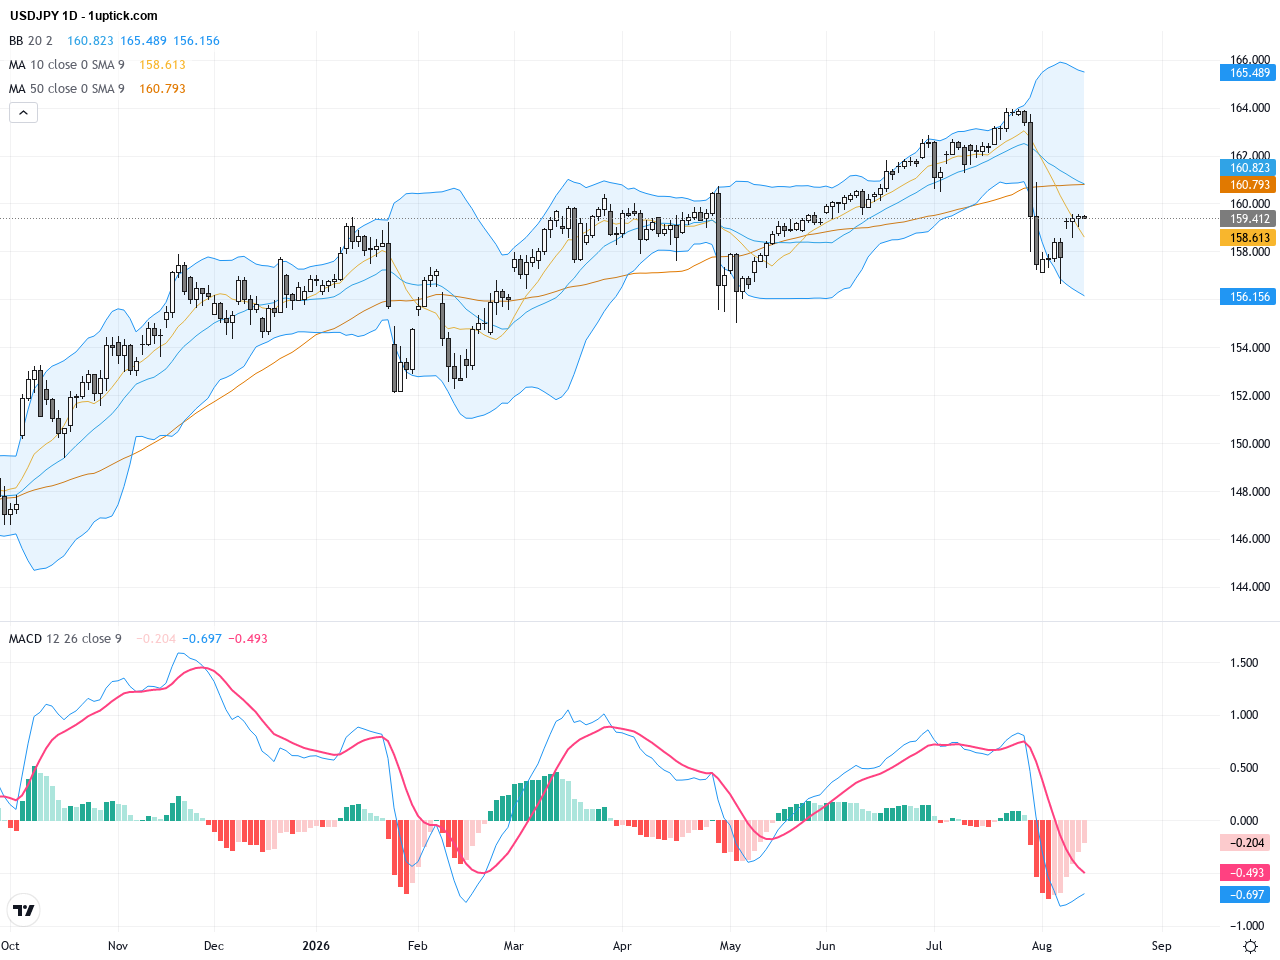
In the past 48 hours, the USD/JPY pair experienced significant volatility as market attention focused on potential further intervention from the Bank of Japan (BOJ) alongside softer US economic data. The pair closed yesterday at 159.412, slightly down by 0.088 points from the previous day, hovering around the critical psychological level between 159 and 160.
This week, weaker-than-expected US non-farm payrolls and Consumer Price Index (CPI) figures raised doubts about the Federal Reserve’s pace of interest rate hikes, putting pressure on the US dollar. Meanwhile, ongoing talks of BOJ rate hikes and intervention provided some support to the Japanese yen. Notably, a recent coordinated US-Japan market intervention amounting to approximately $53 billion temporarily halted the steep decline of USD/JPY but was soon met with rebounds in trading.
For everyday investors, this situation resembles a tug-of-war in the currency markets: Japan is injecting significant capital to prevent rapid depreciation of the yen, boosting confidence in the currency’s floor, while the US dollar shows signs of weakness due to disappointing economic reports. The opposing forces have kept USD/JPY fluctuating within a relatively stable range. Market consensus suggests that the yen’s sustainable uptrend will likely depend on future BOJ rate hikes, and investors should remain vigilant amid potential sharp swings ahead.
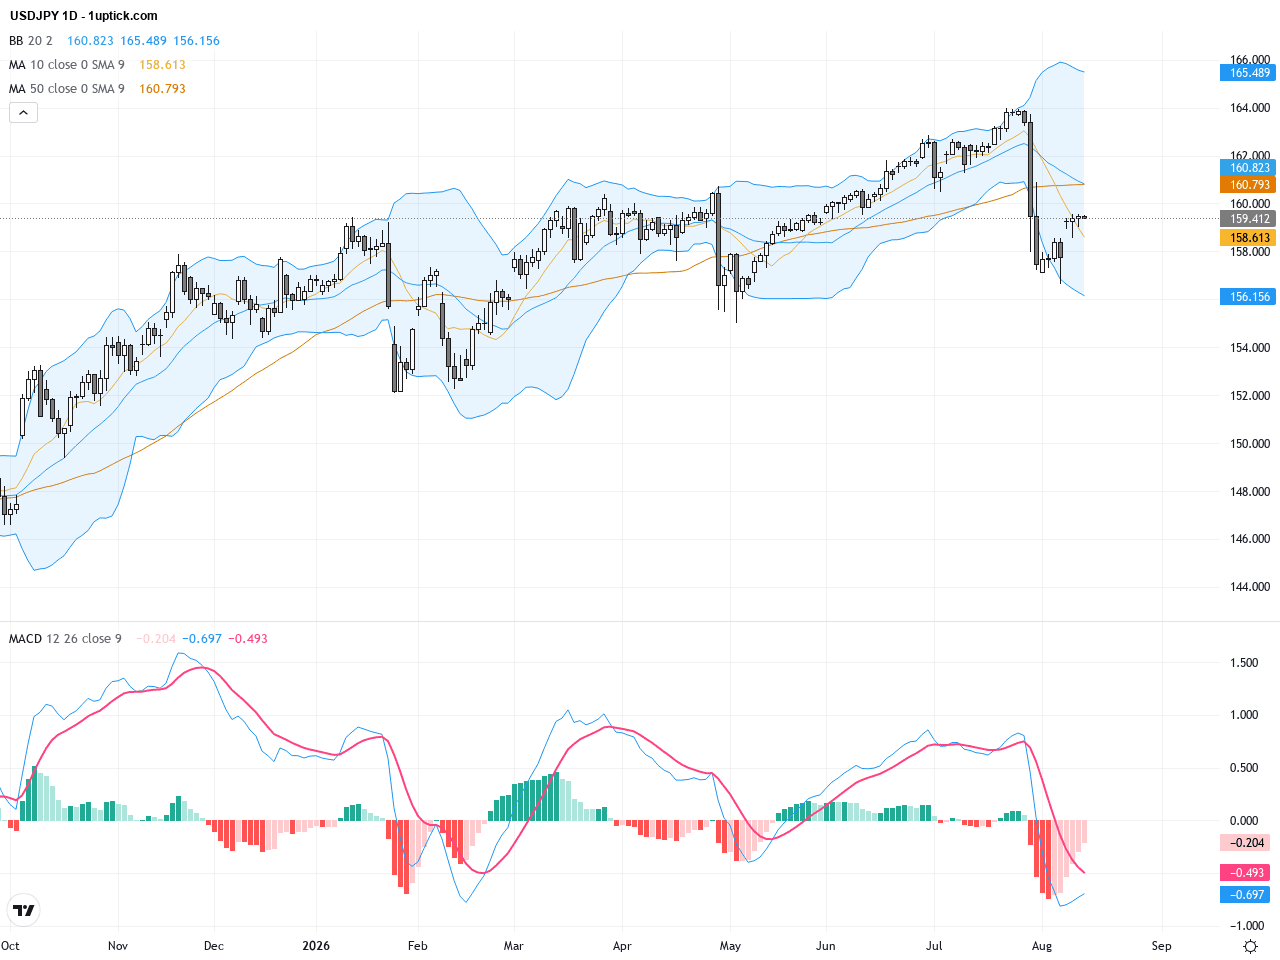
The daily chart shows USDJPY in a long-term uptrend over recent months but currently consolidating near the 200-day moving average at 158.13. The 20-day moving average is flattening, while Bollinger Bands’ middle band acts as resistance. MACD histogram weakening suggests fading bullish momentum. The price action forms a consolidation pattern that could lead to a breakout soon. Traders should watch the critical resistance zone between 159 and 160 for directional clues.
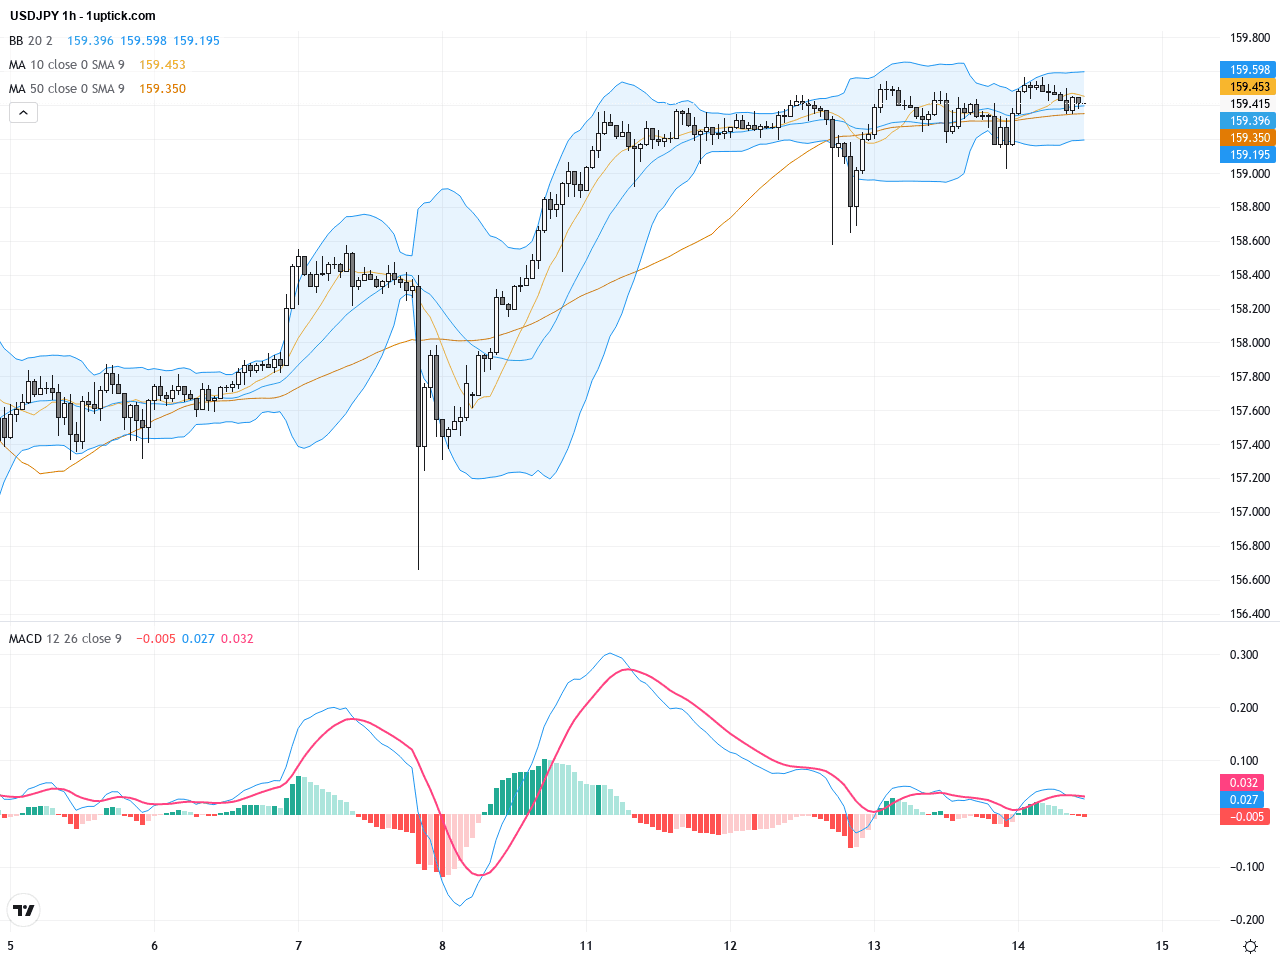
In the last 5 days on the hourly chart, USDJPY has shown increased volatility, with a sharp rally toward 159.7 followed by a rapid decline back near 159. This price action forms a head and shoulders pattern, warning of a near-term pullback risk. Short-term moving averages are turning bearish and MACD recently formed a bearish crossover. Multiple bearish engulfing candlesticks signal sellers controlling the next 24 hours, suggesting traders adopt defensive stances amid potential price swings.
Technical Trend: USDJPY currently exhibits a cautiously bearish short-term correction within a broader sideways consolidation, with no definitive trend direction yet established. Traders should remain cautious and wait for decisive price action beyond critical levels.
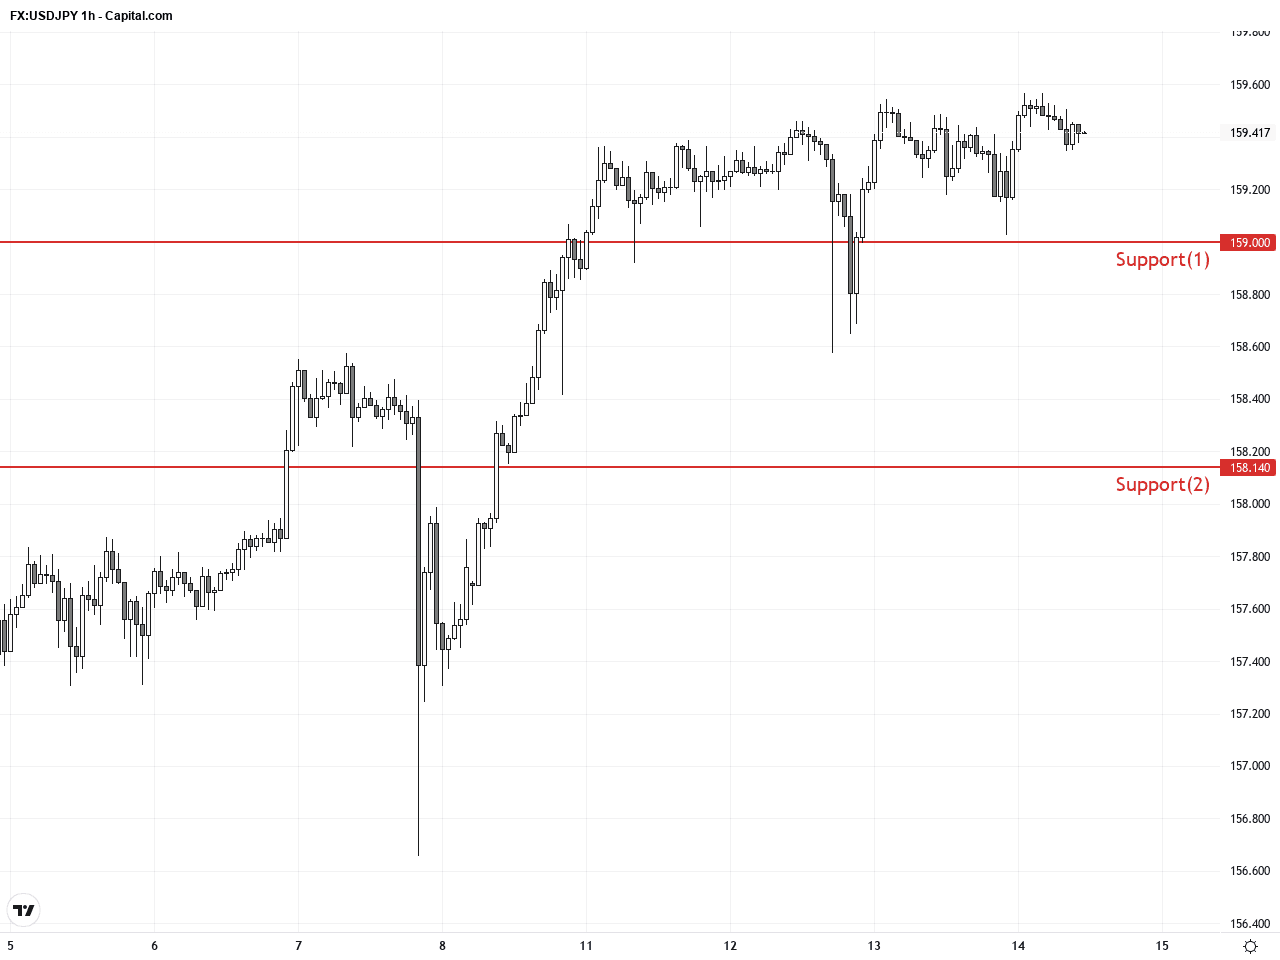
USDJPY is showing a head and shoulders formation with weakening MACD on the daily chart, indicating increased downside risk. While yesterday’s significant yen intervention halted a sharp decline, it has not yet generated a clear reversal signal. The hourly chart’s bearish engulfing candles and MACD death cross imply the bears have short-term control. Key levels near 159 support and 160 resistance will determine if the pair resumes its uptrend or enters corrective consolidation.Today’s economic calendar does not include any major Japanese or US data releases directly impacting USDJPY. There are various inflation and trade data from China and Europe, but these have limited immediate influence on the USD/JPY pair. Market participants should keep an eye on US retail sales figures later, as weaker-than-expected outcomes could further pressure the dollar and support yen strength. Overall, no significant direct events are expected to cause abrupt USDJPY moves today.
Resistance & Support
The above financial market data, quotes, charts, statistics, exchange rates, news, research, analysis, buy or sell ratings, financial education, and other information are for reference only. Before making any trades based on this information, you should consult independent professional advice to verify pricing data or obtain more detailed market information. 1uptick.com should not be regarded as soliciting any subscriber or visitor to execute any trade. You are solely responsible for all of your own trading decisions.