 |
| Gold V.1.3.1 signal Telegram Channel (English) |

EURUSD Technical & Fundamental Analysis: Dollar Weakness Fuels Rebound Near 1.14 Resistance, July 1, 2026
2026-07-01 @ 09:01
Over the past 24 to 48 hours, the EUR/USD exchange rate has seen a rebound driven mainly by U.S. dollar weakness. The pair closed yesterday at 1.14096, reaching an intraday high of 1.14367 while fluctuating around the 1.14 level. The dip in the U.S. dollar index provided momentum for the euro to strengthen, although overall market sentiment remains cautious, reflecting investor uncertainty around future interest rate paths.
Recent market news highlights the U.S. dollar under pressure from Federal Reserve policy headwinds and surprising inflation dynamics, alongside falling 10-year Treasury yields which boosted risk appetite and lowered the dollar index further. Meanwhile, the European Central Bank’s relatively hawkish stance has supported the euro, helping EUR/USD stabilize in the short term. This dynamic has positioned the euro as one of the better-performing G10 currencies, fueling investor optimism about its near-term prospects.
For the average investor, this price movement can be seen as an opportunity amid a softer dollar environment, particularly as easing geopolitical tensions and diminishing expectations for U.S. rate hikes shape sentiment. If you currently hold or are considering buying euros, the current price action indicates the market is adjusting its expectations while awaiting clearer cues from upcoming economic data and central bank decisions.
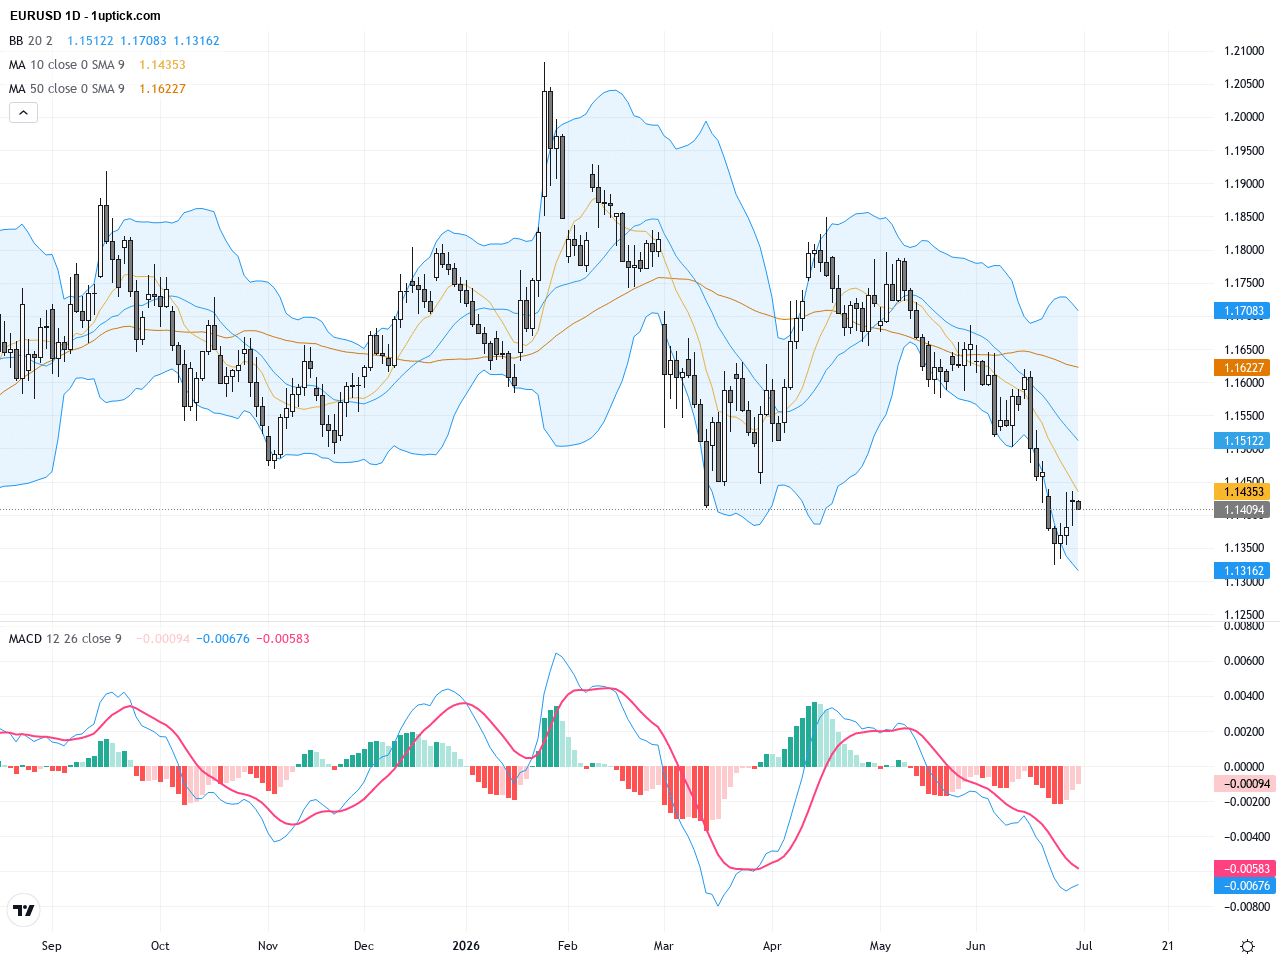
The daily chart shows EURUSD exhibiting a consolidating rebound, rising gradually from the late June low of 1.13254. The 20-day and 50-day moving averages are flattening, indicating equilibrium between buyers and sellers. Bollinger Bands suggest the price is near the upper middle band, signaling potential upward pressure short term. The MACD hovers close to zero, indicating no clear directional momentum, and highlighting cautiousness among traders.
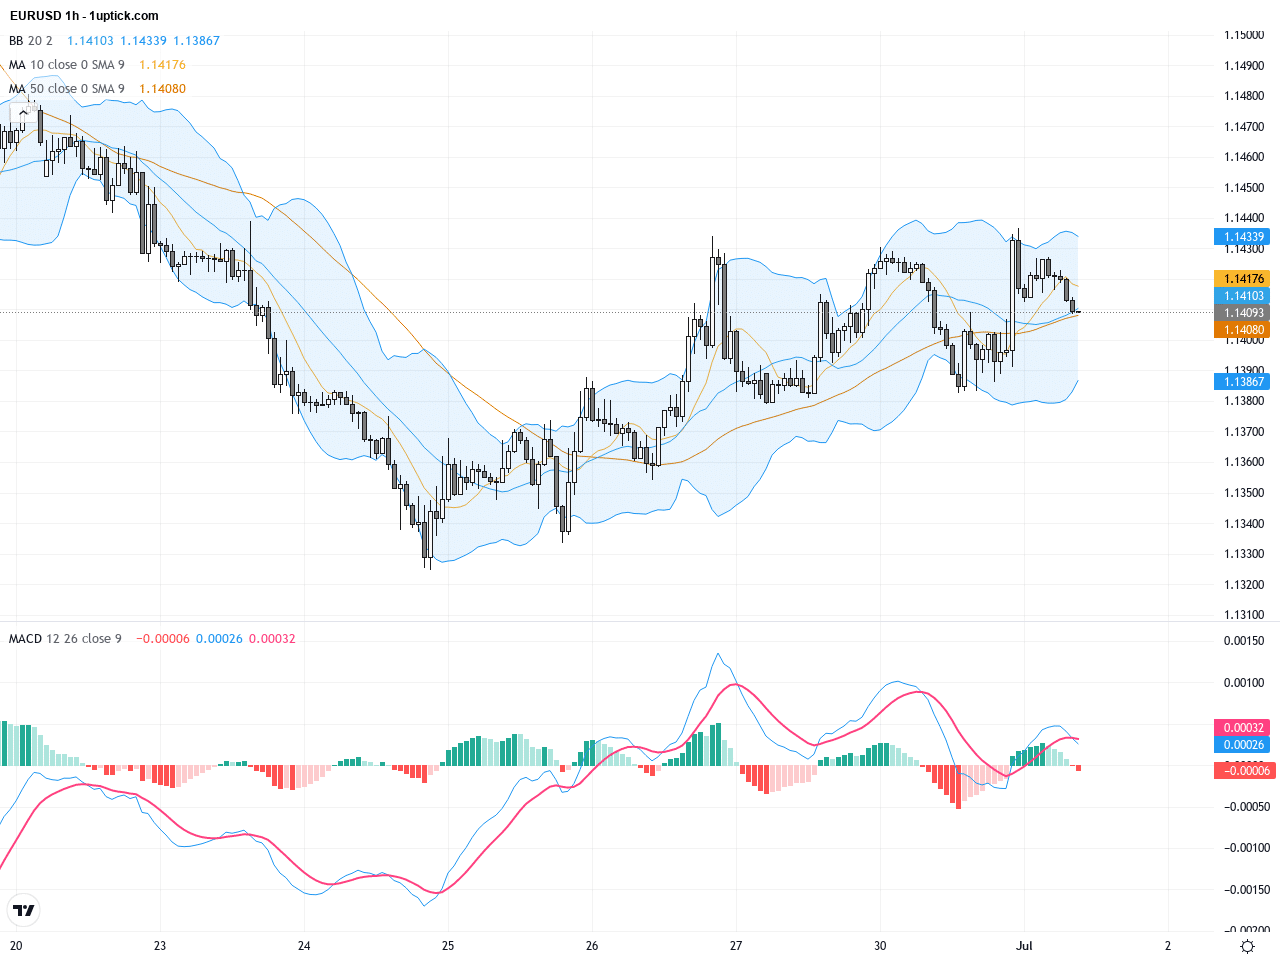
On the hourly chart, EURUSD climbed steadily from around 1.135 in the past 3–5 days to the recent 1.143 area. Price repeatedly tests and slightly breaks the upper Bollinger Band, indicating short-term buying strength. MACD lines are attempting a bullish crossover, and RSI hovers near 60, showing growing momentum, yet resistance tests may limit immediate gains.
Technical Trend: EURUSD currently shows a cautiously bullish trend, overall moving sideways to slightly upward, characterized by measured buying confidence with possible pullbacks.
Technically, EURUSD is at a critical resistance zone with daily and hourly charts showing bullish attempts but limited momentum as indicated by MACD and Bollinger Bands. A recent bullish engulfing candlestick on the daily chart supports short-term upward bias but caution is advised given potential reversals driven by US data and dollar movements.Today’s GMT+1 economic calendar shows no major events directly impacting EURUSD. European consumer price index (CPI) and GDP figures released today may influence sentiment indirectly, while traders await ECB policy cues, but no sharp price volatility from data releases is expected in the short term.
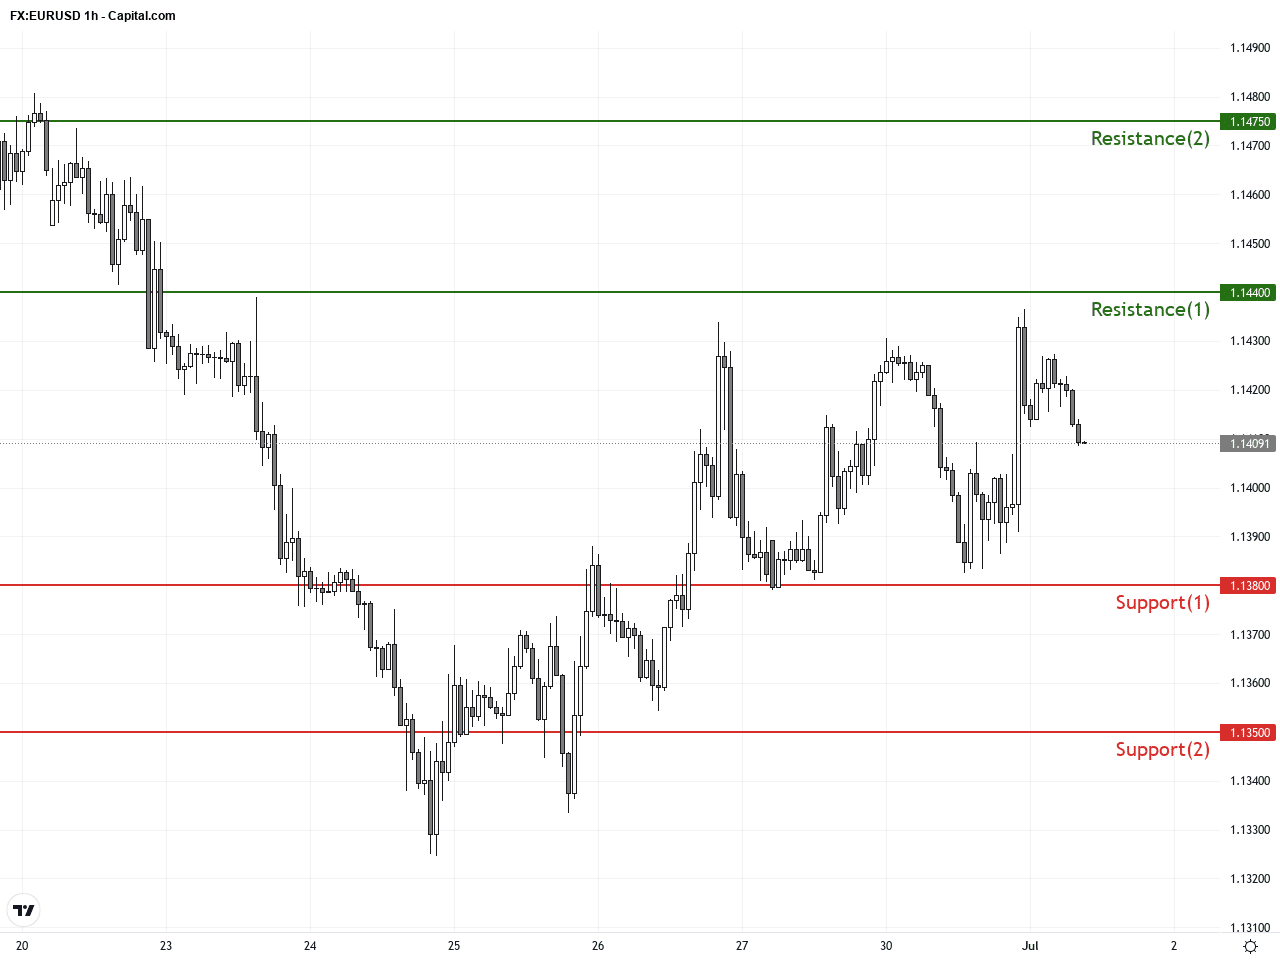
Resistance & Support
The above financial market data, quotes, charts, statistics, exchange rates, news, research, analysis, buy or sell ratings, financial education, and other information are for reference only. Before making any trades based on this information, you should consult independent professional advice to verify pricing data or obtain more detailed market information. 1uptick.com should not be regarded as soliciting any subscriber or visitor to execute any trade. You are solely responsible for all of your own trading decisions.