

 |
| Gold V.1.3.1 signal Telegram Channel (English) |

GBPUSD: Key Technical Patterns and Trading Outlook Amid Mixed Market News, July 1, 2026
2026-07-01 @ 13:01
Over the past 24 to 48 hours, the GBP/USD pair experienced mild adjustment, with prices gently falling from yesterday’s close at 1.3258 to around 1.3241, showing slight volatility. Market sentiment turned cautious as investors weighed the uncertainty surrounding the UK’s political transition alongside a modest rise in US 10-year Treasury yields.
Recent market news indicates that GBP/USD movements have been notably influenced by UK economic data and political outlooks. Revised UK GDP figures confirmed steady economic expansion, providing some underlying support to the pound. However, uncertainty clouded by the resignation of Labour leader Keir Starmer and unclear fiscal policy guidance from the UK finance minister weighed on investor confidence. Meanwhile, the US Federal Reserve’s hawkish stance kept the dollar relatively strong, exerting downward pressure on GBP/USD.
For the average investor, this scenario resembles a short-term volatility amid political uncertainty and global interest rate environment, with GBP/USD reflecting these crosswinds. It is critical to monitor forthcoming UK policy updates and US economic indicators closely. Overall, the recent GBP/USD price action encapsulates the intersection of geopolitical risk and macroeconomic dynamics, urging market participants to remain alert ahead of key policy developments.
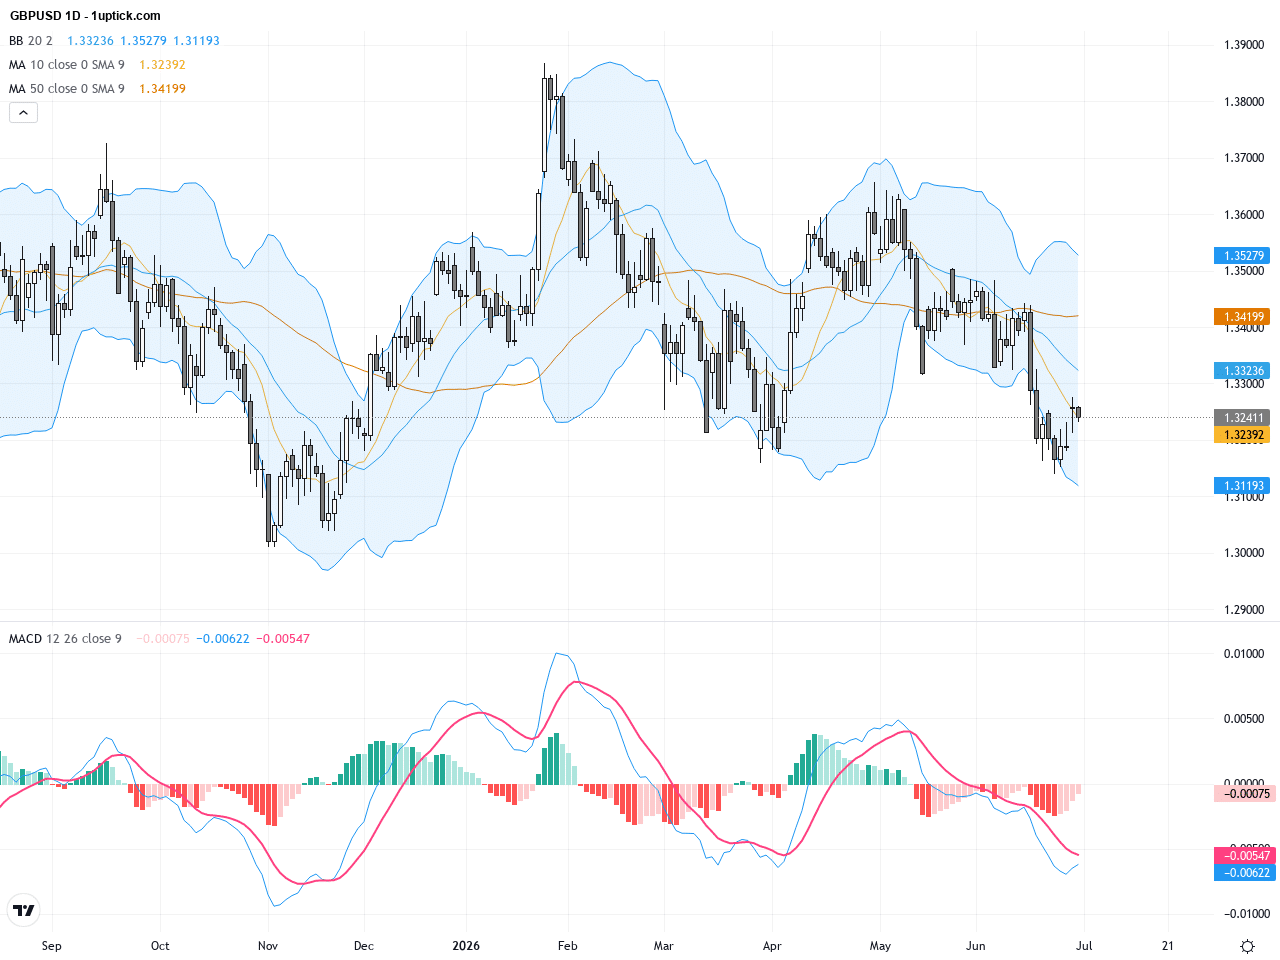
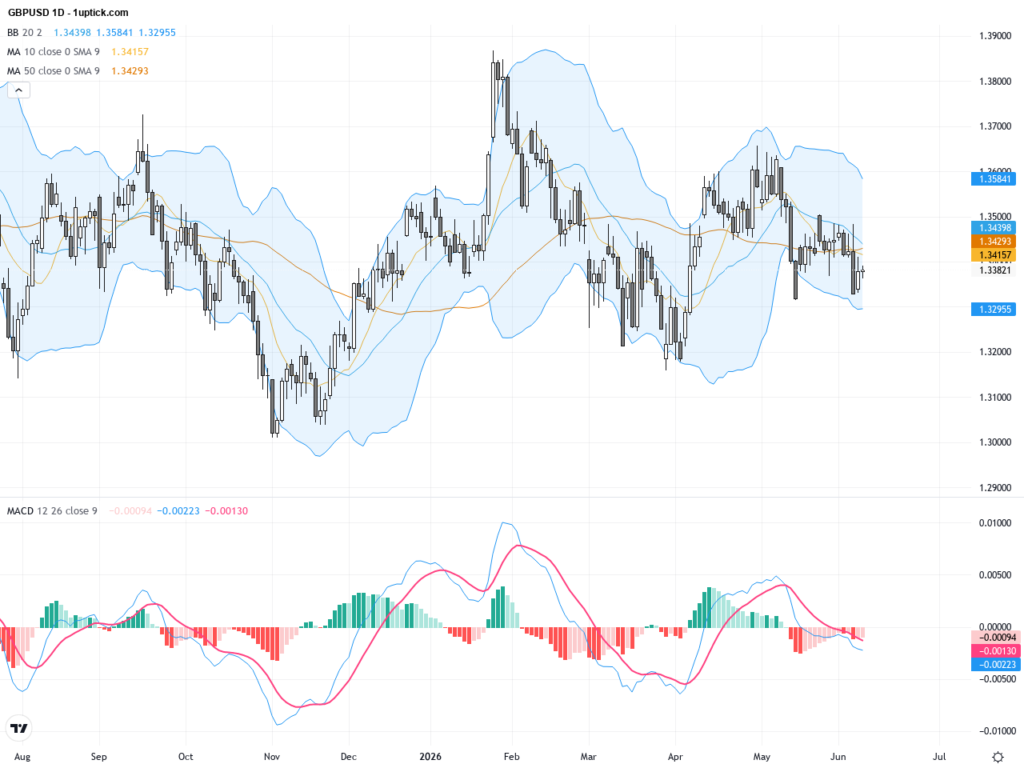
The daily chart shows GBPUSD experiencing a prolonged downtrend since early this year, recently consolidating between 1.32 and 1.34. Both the 50-day and 200-day moving averages sit above current price, acting as resistance. Bollinger Bands have narrowed, suggesting an upcoming volatility expansion. The MACD hovers near the zero line without clear directional cues, indicating a sideways market structure.
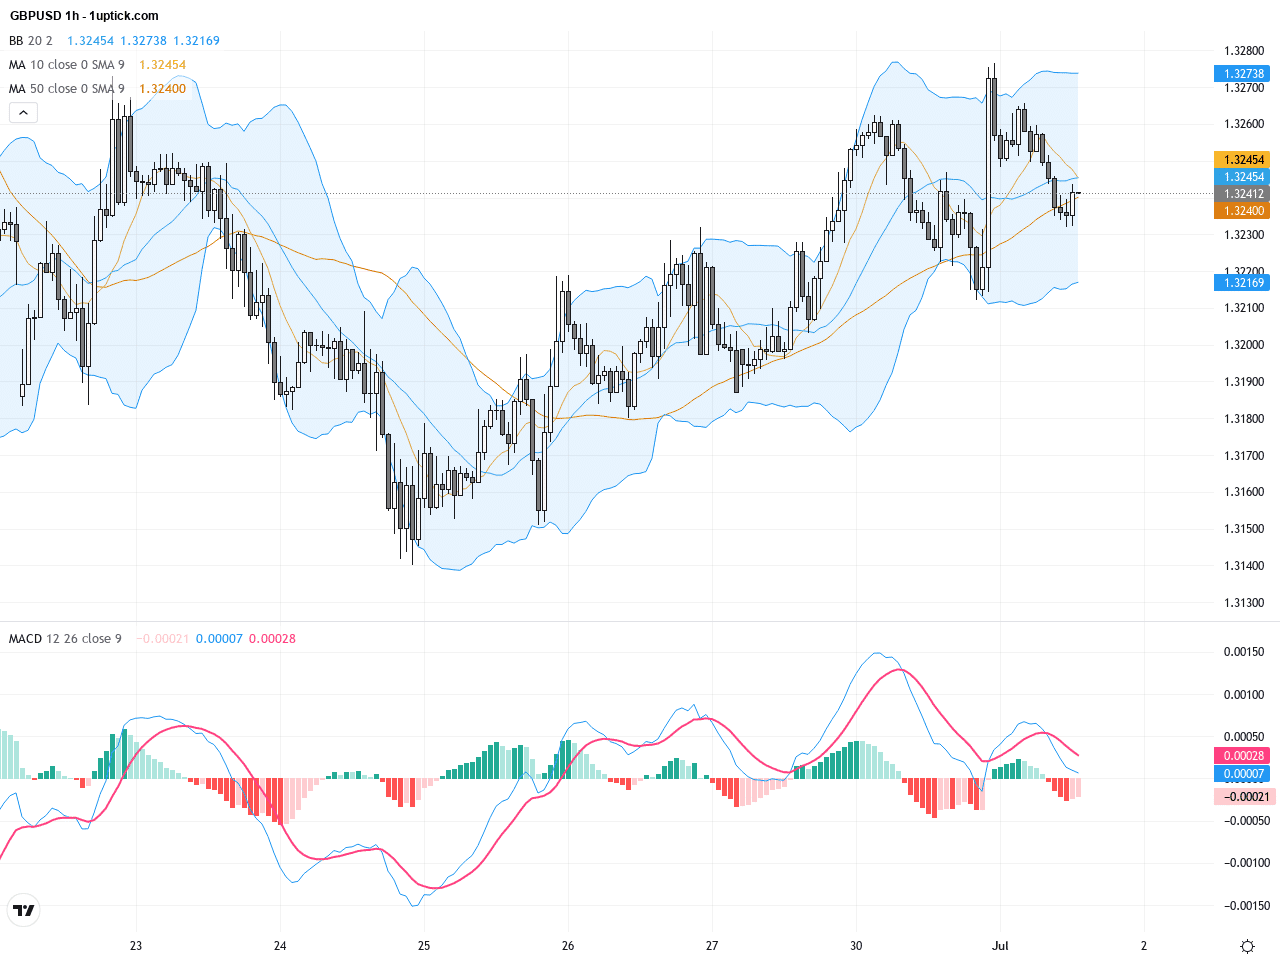
On the hourly timeframe, GBPUSD has traded with several minor pullbacks and rallies over the past 3-5 days. The moving averages are relatively flat or slightly bearish, with price oscillating near the Bollinger Bands middle band. The MACD lines are close to crossing, and RSI remains neutral, signaling indecision. The recent bullish engulfing candlestick points to short-term buying interest, potentially supporting a near-term rebound within the next 24 hours.
Technical Trend: The current trend is best described as volatile sideways, with indecision and range-trading predominating in the short term.
Technically, GBPUSD remains range-bound below key moving averages with resistance at 1.33 and 1.34. Support holds near 1.32. The MACD and RSI on daily charts show no clear divergence, but the hourly bullish engulfing pattern provides a short-term bullish signal. Traders should watch volume and momentum indicators closely, as any strength in US data could trigger renewed downward pressure. Key technical signals suggest a cautious approach while the pair consolidates.Today’s economic calendar, adjusted for HK time, shows no major UK or US data releases directly impacting GBPUSD during Asian trading hours. Several European manufacturing PMIs will be released, but these have limited immediate effect on GBPUSD. Key focus later in the day includes US ADP employment data and ISM Manufacturing PMI; stronger than expected figures could bolster the US dollar and apply downward pressure on GBPUSD. Additionally, Bank of England Governor Bailey’s speech at 22:00 HKT could move the Pound.
Resistance & Support

The above financial market data, quotes, charts, statistics, exchange rates, news, research, analysis, buy or sell ratings, financial education, and other information are for reference only. Before making any trades based on this information, you should consult independent professional advice to verify pricing data or obtain more detailed market information. 1uptick.com should not be regarded as soliciting any subscriber or visitor to execute any trade. You are solely responsible for all of your own trading decisions.